![[Top Answer] MATH225N - Week 3 Assignment - Understanding Measures of Central Tendency - MATH225N Statistical Reasoning for the Health Sciences](https://prolifictutors.com/wp-content/uploads/2022/07/Top-Answer-MATH225N-Week-3-Assignment-Understanding-Measures-of-Central-Tendency-MATH225N-Statistical-Reasoning-for-the-Health-Sciences.jpg)
Description
Week 3 Assignment: Understanding Measures of Central Tendency
| Week | Assignments | Due Date |
| Week 3 | Graded Discussion | Suggested Due Date—
Initial Post: Wednesday of Week 3
Due Date— Responses: Sunday of Week 3 [Have two posts on two different days] |
| Knewton Homework Assignments
Measures of Central Tendency (Section 2.3) Understanding Measures of Central Tendency (Section 2.3 & 2.4) Distribution Shape (Section 2.6) Standard Deviation (Section 2.7) Quartiles and Box Plots (Section 2.2) |
Sunday of Week 3 | |
| Lab #1—Displaying Data | Sunday of Week 3 |
Objectives
3.2 Impact of Outliers on measures of Central Tendency
- Identify the effect of outliers on measures of central tendency
Activity 1
Question
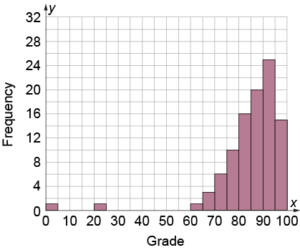
The following histogram represents the grades of all of a teacher’s students on a recent test. What would be the best measure of central tendency for this data set?
Activity 2
Question
The following data set represents the number of times students have been late to their math class.
0, 0, 1, 0, 0, 2, 0, 1, 1, 0, 0, 0, 0, 3, 0, 0, 2
Suppose that the last value, 2, was mistakenly recorded as 20. What measure(s) of the typical value in a data set would be affected by this error? Select all that apply.
Activity 3
Question
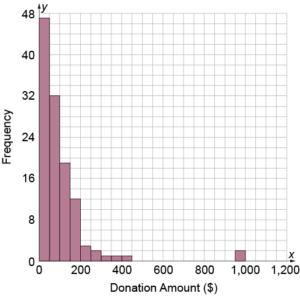
The following histogram shows the dollar amounts of donations collected by a charitable organization over the course of a month. Identify the best measure of central tendency for this data set.
Activity 4
Question
The following data set represents the math test scores for a class of 20 students.
90, 85, 95, 100, 100, 90, 100, 65, 100, 85, 80, 95, 80, 100, 85, 75, 100, 90, 90, 75
Would the mode be a good measure of central tendency for this data set?

![[Solution] - NR305 - Week 6 Assignment: Mental Health Assessment: Amka Oxendine (iHuman) (Graded)](https://prolifictutors.com/wp-content/uploads/2022/06/Solution-NR305-Week-6-Assignment-Mental-Health-Assessment-Amka-Oxendine-iHuman-Graded.png.webp)


Reviews
There are no reviews yet.