Description
Week 3: Measures of Central Tendency and Variation
| Week | Assignments | Due Date |
| Week 3 | Graded Discussion | Suggested Due Date—
Initial Post: Wednesday of Week 3
Due Date— Responses: Sunday of Week 3 [Have two posts on two different days] |
| Knewton Homework Assignments
Measures of Central Tendency (Section 2.3) Understanding Measures of Central Tendency (Section 2.3 & 2.4) Distribution Shape (Section 2.6) Standard Deviation (Section 2.7) Quartiles and Box Plots (Section 2.2) |
Sunday of Week 3 | |
| Lab #1—Displaying Data | Sunday of Week 3 |
—————-
Week 3 Assignment – Standard Deviation
Objectives
3.4 Standard Deviation
- Compute variance and standard deviation
- Understand the standard deviation of a set of data
Activity 1
Question
Find the sample variance of the following set of data:
11, 4, 4, 6, 10.
Round the final answer to one decimal place.
Answer
Access the entire solutions for this week (top graded solutions) by clicking the ‘Buy’ button.
Activity 2
Question
Using the following set of data (the same as in the previous problem), find the sample standard deviation:
11, 4, 4, 6, 10.
Round the final answer to one decimal place.
Answer
Access the entire solutions for this week (top graded solutions) by clicking the ‘Buy’ button.
Activity 3
Question
Which of the following lists of data has the largest standard deviation
- 18, 17, 15, 17, 18, 19, 18, 17, 19, 17
- 27, 25, 25, 24, 31, 23, 29, 22, 32, 26
- 16, 12, 16, 15, 14, 13, 14, 15, 12, 14
- 17, 19, 17, 17, 16, 15, 16, 18, 19, 17
- 13, 17, 15, 13, 13, 13, 15, 15, 13, 13
Answer
Access the entire solutions for this week (top graded solutions) by clicking the ‘Buy’ button.
Activity 4
Question
Which of the following lists of data has the largest standard deviation?
Select the correct answer below:
- 22, 25, 25, 22, 25, 23, 24, 23, 26, 24
- 13, 11, 11, 11, 10, 14, 14, 10, 11, 11
- 16, 14, 15, 15, 16, 16, 15, 16, 18, 14
- 25, 23, 25, 22, 21, 25, 22, 21, 25, 23
- 7, 14, 19, 18, 4, 16, 5, 11, 11, 12
Answer
Access the entire solutions for this week (top graded solutions) by clicking the ‘Buy’ button.
Activity 5
Question
The following dataset represents the salaries for all six employees at a small start-up company.
Find the mean, variance, and standard deviation for this dataset of salaries (expressed in thousands of dollars):
55, 59, 63, 67, 71, 75
(Round your answers to one decimal place)
Select the correct answer below:
Answer
Access the entire solutions for this week (top graded solutions) by clicking the ‘Buy’ button.
Activity 6
Question
A company is interested to know the variation in yearly sales amount for all 5 salespeople in the company.
The dataset shown below is the sales amount sold by the 5 salespeople in the company (expressed in thousands of dollars):
40,60,65,70,80
Find the variance for this dataset.
Provide your answer below:
Answer
Access the entire solutions for this week (top graded solutions) by clicking the ‘Buy’ button.
Activity 7
Question
A large company is interested to know the variation in yearly sales for its salespeople. The dataset shown below is the yearly sales for a sample of 5 salespeople (expressed in thousands of dollars):
40, 60, 65, 70, 80
Find the variance for this dataset.
Round the final answer to the nearest whole number.
Answer
Access the entire solutions for this week (top graded solutions) by clicking the ‘Buy’ button.
Activity 8
Question
Which of the data sets represented by the following histograms has the smallest standard deviation?
Select the correct answer below:
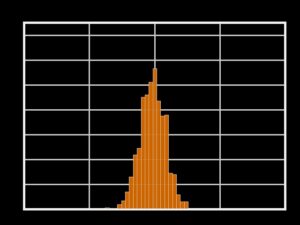
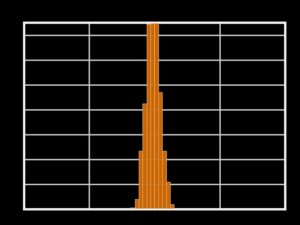

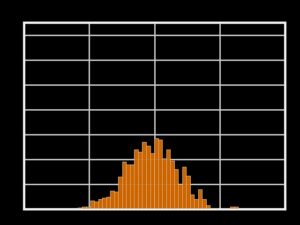
Answer
Access the entire solutions for this week (top graded solutions) by clicking the ‘Buy’ button.
Activity 9
Question
Which of the data sets represented by the following histograms has the smallest standard deviation?
Select the correct answer below:
- 30, 21, 19, 17, 16, 32, 26, 25, 19, 16
- 5, 11, 15, 7, 5, 9, 8, 16, 14, 11
- 25, 24, 28, 18, 32, 34, 34, 22, 28, 19
- 17, 19, 17, 18, 17, 16, 16, 16, 17, 20
- 9, 16, 14, 22, 20, 9, 19, 16, 21, 8
Answer
Access the entire solutions for this week (top graded solutions) by clicking the ‘Buy’ button.
Activity 10
Question
Which of the data sets represented by the following histograms has the smallest standard deviation?
Select the correct answer below:
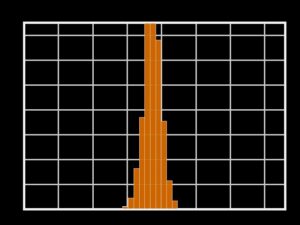
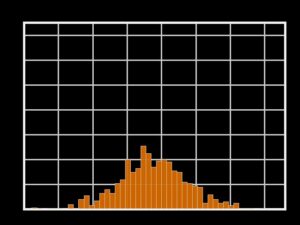
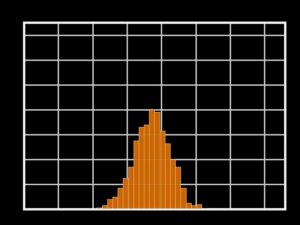
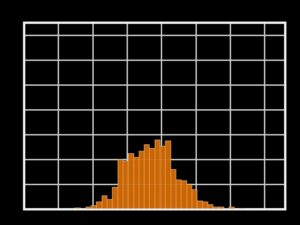
Answer
Access the entire solutions for this week (top graded solutions) by clicking the ‘Buy’ button.
Activity 11
Question
Which of the following lists of data has the largest standard deviation?
Select the correct answer below:
- 9, 11, 13, 10, 13, 13, 13, 9, 9, 10
- 24, 15, 21, 23, 9, 22, 12, 21, 20, 13
- 15, 18, 18, 18, 18, 15, 15, 15, 16, 16
- 23, 24, 23, 24, 26, 25, 26, 23, 26, 24
- 10, 12, 13, 11, 11, 14, 14, 11, 12, 12
Answer
Access the entire solutions for this week (top graded solutions) by clicking the ‘Buy’ button.
Activity 12
Question
The following data values represent the daily amount spent by a family during a 7 day summer vacation.
Find the population standard deviation of this dataset:
$96, $125, $80, $110, $75, $100, $121
Answer
Access the entire solutions for this week (top graded solutions) by clicking the ‘Buy’ button.
Activity 13
Question
The data below are the monthly average high temperatures for November, December, January, and February in New York City from the Country Studies/Area Handbook Series sponsored by the U.S. Department of the Army between 1986 and 1998. What is the sample standard deviation?
54,42,40,40
Round the final answer to one decimal place.
Select the correct answer below:
- 7
- 3
- 3
- 136
Answer
Access the entire solutions for this week (top graded solutions) by clicking the ‘Buy’ button.

![[Top Answer] MATH225N - Week 3 Assignment Standard Deviation](https://prolifictutors.com/wp-content/uploads/2022/07/Top-Answer-MATH225N-Week-3-Assignment-Standard-Deviation.jpg)


![[Top Answer] MATH225N - Week 1 Assignment - Evidence, Claims and Study Types - MATH225N Statistical Reasoning for the Health Sciences](https://prolifictutors.com/wp-content/uploads/2022/07/Top-Answer-MATH225N-Week-1-Assignment-Evidence-Claims-and-Study-Types-MATH225N-Statistical-Reasoning-for-the-Health-Sciences.jpg)


Reviews
There are no reviews yet.