![[Top Answer] MATH225N - Week 2 Assignment - Stem and Leaf plots - MATH225N Statistical Reasoning for the Health Sciences](https://prolifictutors.com/wp-content/uploads/2022/07/Top-Answer-MATH225N-Week-2-Assignment-Stem-and-Leaf-plots-MATH225N-Statistical-Reasoning-for-the-Health-Sciences.jpg)
Description
Week 2 Assignment: Stem and Leaf plots
| Week | Assignments | Due Date |
| Week 2 | Graded Discussion | Due Date—
Responses: Sunday of Week 2 [Have two posts on two different days] |
| Knewton Homework Assignments
Frequency Tables (Section 2.1) Frequency Tables & Histograms (Section 2.1) Stem & Leaf (Section 2.1) Line & Bar Graphs (Section 2.1) |
Sunday of Week 2 | |
| Knewton Quiz #1
· Covers Week 1 – 2 Material · 25 Questions · 2 Attempts |
Sunday of Week 2 |
Objectives
2.5 Dot Plots and Stem and Leaf plots
- Create and interpret stem-and-leaf plots
Activity 1
Question
A set of data is summarized by the stem and leaf plot below.
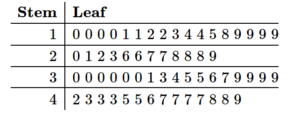
Which of the following statements are true? Select all correct answers.
Activity 2
Question
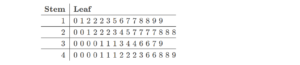
A set of data is summarized by the stem and leaf plot below.
Activity 3
Question
A set of data is summarized by the stem and leaf plot below.

Activity 4
Question
A set of data is summarized by the stem and leaf plot below.

![[Solution] - NR305 - Week 6 Discussion: Reflection on Nursing Assessment for Violence (Graded)](https://prolifictutors.com/wp-content/uploads/2022/06/Solution-NR305-Week-6-Discussion-Reflection-on-Nursing-Assessment-for-Violence-Graded.png.webp)


![[Solution] - NR305 - Week 6 Assignment: Mental Health Assessment: Amka Oxendine (iHuman) (Graded)](https://prolifictutors.com/wp-content/uploads/2022/06/Solution-NR305-Week-6-Assignment-Mental-Health-Assessment-Amka-Oxendine-iHuman-Graded.png.webp)
![[Top Answer] MATH225N - Week 1 Assignment - Comparing Sampling Methods - MATH225N Statistical Reasoning for the Health Sciences](https://prolifictutors.com/wp-content/uploads/2022/07/Top-Answer-MATH225N-Week-1-Assignment-Comparing-Sampling-Methods-MATH225N-Statistical-Reasoning-for-the-Health-Sciences.jpg)

Reviews
There are no reviews yet.