![[Top Answer] MATH225N - Week 2 Assignment - Line and Bar Graphs - MATH225N Statistical Reasoning for the Health Sciences](https://prolifictutors.com/wp-content/uploads/2022/07/Top-Answer-MATH225N-Week-2-Assignment-Line-and-Bar-Graphs-MATH225N-Statistical-Reasoning-for-the-Health-Sciences.jpg)
Description
Week 2 Assignment: Line and Bar Graphs
| Week | Assignments | Due Date |
| Week 2 | Graded Discussion | Due Date—
Responses: Sunday of Week 2 [Have two posts on two different days] |
| Knewton Homework Assignments
Frequency Tables (Section 2.1) Frequency Tables & Histograms (Section 2.1) Stem & Leaf (Section 2.1) Line & Bar Graphs (Section 2.1) |
Sunday of Week 2 | |
| Knewton Quiz #1
· Covers Week 1 – 2 Material · 25 Questions · 2 Attempts |
Sunday of Week 2 |
Objectives
2.6 Line and Bar Graphs
- Create and interpret bar graphs
- Create and interpret line graphs of data
Activity 1
Question
The bar graph below shows the number of boys and girls in different classes.
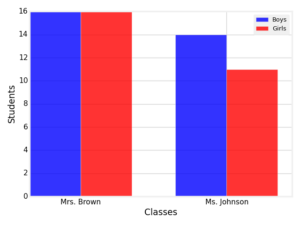
A side-by-side bar chart has a horizontal axis labeled Classes with teachers Mrs. Brown and Ms. Johnson and a vertical axis labeled Students from 0 to 16 in increments of 2. There are two vertical bars above each horizontal teacher label, with the bar on the left representing Boys and the bar on the right representing Girls. The heights of the bars are as follows, where the teacher is listed first, and the heights of the bars are listed next from left to right: Mrs. Brown, 16 and 16; Ms. Johnson, 14 and 11.
What is the total number of boys across all the classes shown? Do not include the units in your answer.
Activity 2
Question
The data listed below represent the number of TVs in a house by family size.
| Family Size | Number of TVs |
| 2 | 1 |
| 3 | 2 |
| 4 | 3 |
| 6 | 6 |
| 8 | 6 |
Create the corresponding line graph to represent this data below.
Make sure to drag the points according to the x values in ascending order, to avoid overlapping segments of the line, as this can be marked incorrect.
Activity 3
Question
According to the information above, what family sizes have 6 TVs in their household?
Activity 4
Question
A movie theater is researching its customer’s favorite movie genres. The following table shows the favorite movie genres of the selected customers.
| Movie Genre | Frequency |
| Comedy | 7 |
| Romance | 3 |
| Science Fiction | 6 |
| Action | 6 |
| Drama | 5 |
Create the corresponding bar graph to represent this data below. Drag the dots on the top of the bar graph to create the chart.
Activity 5
Question
Which movie genre was selected as the most popular by the sampled movie theater customers?
Activity 6
Question
A travel agency is conducting research on how many times families went on vacation during the last year. The following table shows the number of times sampled families went on vacation.
| Vacation | Frequency |
| None | 3 |
| Once | 11 |
| Twice | 9 |
| Three times | 6 |
| Four times | 3 |
Create the corresponding bar graph to represent this data below. Drag the dots on the top of the bar graph to create the chart.
Activity 7
Question
According to the given data, what can the travel agency conclude about the sampled families?
Activity 8
Question
Josslyn is a car salesperson who keeps track of her sales over time. The line graph below shows how many cars she sells per week.
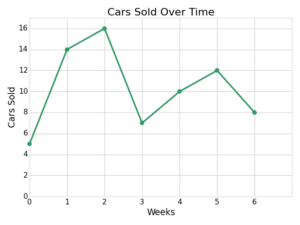
What was the change in cars sold from week 2 to 6? Do not include the unit in your answer.
Activity 9
Question
Marc is keeping track of the total number of movies he has watched over time. The line graph below shows the data, where the vertical axis corresponds to the total number of movies that had been watched since day 0 by the beginning of the week shown on the horizontal axis.
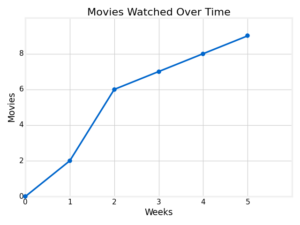
How many movies did Marc watch between the beginning of week 1 and the beginning of week 5? Do not include the unit in your answer.

![[Solution] - NR305 - Week 5 Discussion: Debriefing of Week 4 iHuman Neurovascular Assessment (Graded)](https://prolifictutors.com/wp-content/uploads/2022/06/Solution-NR305-Week-5-Discussion-Debriefing-of-Week-4-iHuman-Neurovascular-Assessment-Graded.png.webp)
![[Solution] - NR305 - Week 6 Discussion: Reflection on Nursing Assessment for Violence (Graded)](https://prolifictutors.com/wp-content/uploads/2022/06/Solution-NR305-Week-6-Discussion-Reflection-on-Nursing-Assessment-for-Violence-Graded.png.webp)
![[Top Answer] MATH225N - Week 1 Assignment - Comparing Sampling Methods - MATH225N Statistical Reasoning for the Health Sciences](https://prolifictutors.com/wp-content/uploads/2022/07/Top-Answer-MATH225N-Week-1-Assignment-Comparing-Sampling-Methods-MATH225N-Statistical-Reasoning-for-the-Health-Sciences.jpg)

Reviews
There are no reviews yet.