Description
Week 2 – Graphing and Describing Data
| Week | Assignments | Due Date |
| Week 2 | Graded Discussion | Due Date—
Responses: Sunday of Week 2 [Have two posts on two different days] |
| Knewton Homework Assignments
Frequency Tables (Section 2.1) Frequency Tables & Histograms (Section 2.1) Stem & Leaf (Section 2.1) Line & Bar Graphs (Section 2.1) |
Sunday of Week 2 | |
| Knewton Quiz #1
· Covers Week 1 – 2 Material · 25 Questions · 2 Attempts |
Sunday of Week 2 |
—————-
Week 2 Assignment – Frequency Tables and Histograms
Objectives
2.1 Frequency Tables and Histograms
- Create and interpret histograms
- Identify and label shapes of histograms
Activity 1
Question
Randomly selected adults at a coffee shop were asked how many hours they work in a typical workday. The results are tabulated in the following frequency table.
Which histogram accurately summarizes the data?
| Value | Frequency |
| 4 | 2 |
| 5 | 1 |
| 6 | 4 |
| 7 | 2 |
| 8 | 1 |
| 9 | 4 |
| 10 | 10 |
Answer
Access the entire solutions for this week (top graded solutions) by clicking the ‘Buy’ button.
Activity 2
Question
A student surveys his class and creates a histogram showing the number of pets in each student’s house. What is the shape of the distribution?
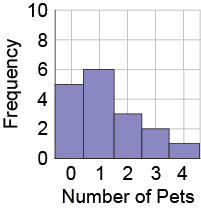
Select the correct answer below:
- uniform
- unimodal and symmetric
- unimodal and left-skewed
- unimodal and right-skewed
- Bimodal
Answer
Access the entire solutions for this week (top graded solutions) by clicking the ‘Buy’ button.
Activity 3
Question
Given the following histogram for a set of data, how many values in the data set are greater than 5.5 but less than 8.5?
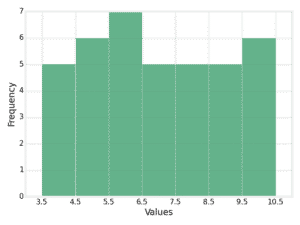
Provide your answer below:
Answer
Access the entire solutions for this week (top graded solutions) by clicking the ‘Buy’ button.
Activity 4
Question
The students in a first-grade class were all asked to time how long (in seconds) they could hold their breath. The results were tallied and are presented in the following histogram.
How many of those students held their breath greater than 12.5 and less than 15.5 seconds?
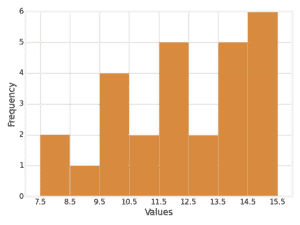
Provide your answer below:
Answer
Access the entire solutions for this week (top graded solutions) by clicking the ‘Buy’ button.
Activity 5
Question
Describe the shape of the given histogram.
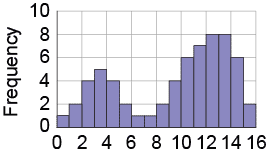
Select the correct answer below:
- uniform
- unimodal and symmetric
- unimodal and left-skewed
- unimodal and right-skewed
- bimodal
Answer
Access the entire solutions for this week (top graded solutions) by clicking the ‘Buy’ button.
Activity 6
Question
Describe the shape of the given histogram.
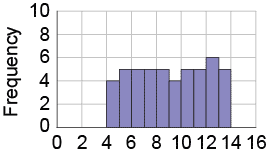
Select the correct answer below:
- uniform
- unimodal and symmetric
- unimodal and left-skewed
- unimodal and right-skewed
- bimodal
Answer
Access the entire solutions for this week (top graded solutions) by clicking the ‘Buy’ button.
Activity 7
Question
Randomly selected individuals at a fashion store were asked how many fashion accessories they currently own. The results are displayed in the following frequency table.
Which histogram accurately summarizes the data?
| Value | Frequency |
| 8 | 3 |
| 9 | 2 |
| 10 | 4 |
| 11 | 3 |
| 12 | 0 |
| 13 | 4 |
| 14 | 2 |
| 15 | 5 |
| 16 | 10 |
Answer
Access the entire solutions for this week (top graded solutions) by clicking the ‘Buy’ button.
Activity 8
Question
The speed (in mph) of randomly selected bicyclists were measured as they were approaching a hill. The results are presented in the following histogram.
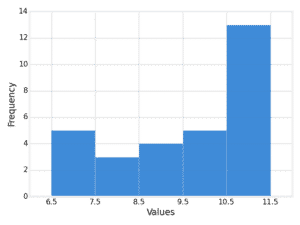
How many of those bicyclists were traveling at least 8.5 and less than 11.5 mph as they were approaching the hill?
Answer
Access the entire solutions for this week (top graded solutions) by clicking the ‘Buy’ button.
Activity 9
Question
A professor gave students a test, and the distribution of the scores of the students is shown in the histogram below. What shape does the distribution have?
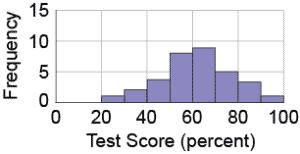
Select the correct answer below:
- uniform
- unimodal and symmetric
- unimodal and left-skewed
- unimodal and right-skewed
- bimodal
Answer
Access the entire solutions for this week (top graded solutions) by clicking the ‘Buy’ button.
Activity 10
Question
The histogram below represents the prices of digital SLR camera models at a store. Describe the shape of the distribution.
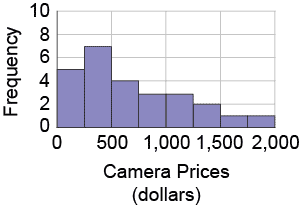
Select the correct answer below:
- uniform
- unimodal and symmetric
- unimodal and left-skewed
- unimodal and right-skewed
- bimodal
Answer
Access the entire solutions for this week (top graded solutions) by clicking the ‘Buy’ button.
Activity 11
Question
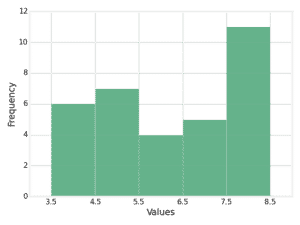
Several people were asked to report the number of hours of sleep they average per night. The results are shown in the histogram below. How many of those people average greater than 4.5 and less than 6.5 hours of sleep per night?
Answer
Access the entire solutions for this week (top graded solutions) by clicking the ‘Buy’ button.
Activity 12
Question
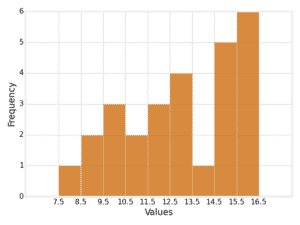
Given the following histogram for a set of data, how many values in the data set are greater than 10.5 and less than 12.5?
Answer
Access the entire solutions for this week (top graded solutions) by clicking the ‘Buy’ button.

![[Top Answer] MATH225N - Week 2 Assignment Frequency Tables and Histograms](https://prolifictutors.com/wp-content/uploads/2022/07/Top-Answer-MATH225N-Week-2-Assignment-Frequency-Tables-and-Histograms.jpg)


![[Solution] - NR305 - Week 6 Discussion: Reflection on Nursing Assessment for Violence (Graded)](https://prolifictutors.com/wp-content/uploads/2022/06/Solution-NR305-Week-6-Discussion-Reflection-on-Nursing-Assessment-for-Violence-Graded.png)

![[Solution] - NR305 - Week 5 Discussion: Debriefing of Week 4 iHuman Neurovascular Assessment (Graded)](https://prolifictutors.com/wp-content/uploads/2022/06/Solution-NR305-Week-5-Discussion-Debriefing-of-Week-4-iHuman-Neurovascular-Assessment-Graded.png)


Reviews
There are no reviews yet.