MATH225N – Statistical Reasoning for the Health Sciences Week 1-8 Study Guide and Solutions (Chamberlain College of Nursing)
June 22, 2022 2022-06-22 21:39MATH225N – Statistical Reasoning for the Health Sciences Week 1-8 Study Guide and Solutions (Chamberlain College of Nursing)
![[Solution] - MATH225N - Statistical Reasoning for the Health Sciences (Chamberlain College of Nursing) Week 1-8 Study Guide With Questions and Answers for Revision - Latest](https://prolifictutors.com/wp-content/uploads/2022/06/Solution-MATH225N-Statistical-Reasoning-for-the-Health-Sciences-Chamberlain-College-of-Nursing-Week-1-8-Study-Guide-With-Questions-and-Answers-for-Revision-Latest.png)
MATH225N – Statistical Reasoning for the Health Sciences Week 1-8 Study Guide and Solutions (Chamberlain College of Nursing)
This document is your one-stop-shop for all the answers to assignments, discussions, and quizzes for MATH225N.
It can as a revision guide at any stage of the class. It contains all the information sequentially organized.
You can purchase the full document or individual answers based on your needs.
Overview
This table presents a summary of the MATH225N course at Chamberlain College of Nursing.
| Course Code | MATH225N/ MATH 225N |
| Course Title/Name | Statistical Reasoning for the Health Sciences |
| Course Credits | 4 |
| Prerequisite for the course | None |
————
Textbook and Resources
MATH225N Approved textbook
The following textbook is required for the course

The book is called “Introductory Business Statistics by OpenStax” authored by Alexander Holmes, The University of Oklahoma, Barbara Illowsky, De Anza College, and Susan Dean, De Anza College.
You can get it for FREE on Z-Library here – Introductory Business Statistics (Fall 2020 Corrected Edition) | Alexander Holmes; Barbara Illowsky; Susan Dean | download (usa1lib.org)
Chamberlain recommends you download it here – https://openstax.org/details/books/introductory-business-statistics
Excel
Throughout this course, most calculations will be done through Excel. Excel spreadsheets will be provided each week within the lesson.
Calculator
You will still need a calculator with an exponent key. This could be a hand-held calculator, Excel calculator, or phone calculator (if allowed by your instructor).
Computer Software
Your course work, quizzes, and tests will be handled through Knewton’s Alta program. This program is an adaptive learning technology that helps to identify each student’s particular strengths and weaknesses. This platform makes custom recommendations based on each student’s proficiency and needs.
Statistics is largely a science of collecting, organizing and interpreting data. We will be learning about different types of data and how to use them, and you will see how we can take data from the health sciences and make statistically based decisions.
Course Outcomes
- Given scenarios supported by population data, apply sampling techniques and explain potential pitfalls and bias in data collection.
- Given datasets with qualitative and quantitative data, differentiate between the types of data and how they can be applied in statistical studies for everyday life.
Course Description
In MATH225N, you will be focusing on how statistics are interpreted and used in medical research, and how that helps in the continual improvement in health services.
Learning statistics will take commitment. If this is your introduction to statistics, then you may be a bit apprehensive. Once you see how you have been surrounded by statistics, you will likely realize that many of these topics are already familiar.
Each week, you will be challenged with homework assignments that involve some calculations while focusing on the interpretation and meaning of the statistics. While some calculations are required, the most important part of statistics is interpreting what you see. This perspective will give you the confidence to say, “I worked this problem and this is what it tells us.” You will practice speaking this new language in the weekly discussions. When you learn a new topic, you need to become comfortable talking about it. Your classmates are in the same situation, so be ready to talk to them about the new things you are learning. Use this communication to ask questions or to help out your fellow classmates.
Weeks, Course Outcomes, Topics, and Assessments
The following are the weekly course readings, topics, and assignments (discussions) for MATH225N.
Week 1 – Introduction to Statistics
| Week | Assignments | Due Date |
| Week 1 | Introduction Forum (Not graded but required) | Suggested Due Date: Wednesday of Week 1 |
| Graded Discussion | Suggested Due Date— Initial Post: Wednesday of Week 1 Due Date— Responses: Sunday of Week 1 [Have two posts on two different days] | |
| Knewton Homework Assignments Evidence, Claims and Study Types (Section 1.4) Variable and Measures of Data (Section 1.3) Sampling Methods (Section 1.2) Comparing Sampling Methods (Section 1.2) | Sunday of Week 1 |
————
Week 1 Assignment: Evidence, Claims, and Study Types
Objectives
1.1 Evidence, Claims and Study Types
- Identify and describe the steps in the statistical analysis process
- Determine whether a study is observational or an experiment and appropriate use cases
- Identify components of the experimental design in a given experiment: use of a control group, use of a placebo, and blinding
Activity 1
Question
A researcher is interested in the effects of watching videos just before bed on the quality of sleep. He has decided to test the claim that “Watching 1 hour of video just before going to bed reduces the number of minutes of REM sleep by more than 10%.” How should the number of hours of video be treated?
Activity 2
Question
Identify and describe the steps in the statistical analysis process
The goal of statistics is to use data to understand something about the world. To obtain useful results, a scientific approach should be followed. The basic approach can be summarized in a few steps.
- Write a question that can be answered by collecting data.
- Determine what variables to measure and how to collect a data sample.
- Analyze the data and create appropriate summaries.
- Create a report of the results, drawing conclusions or inferences where appropriate.
For example, suppose you are the owner of a small business that helps local farmers sell their produce at grocery stores in a city. The farmers are interested in knowing what crops they should produce and look to you to help provide some guidance. This type of question can be better understood using statistical analysis. The four steps of the statistical process are described in general and then applied to this situation in the table below.
Write a question
Writing a question or claim involves identifying the group of items or individuals of interest, or the population. Then, you must determine what kind of information about that population is important.
The group of interest is the people living in the city who shop for food at grocery stores. To help the farmers, you need to answer the question “What kinds of produce do those people buy and in what amounts?”
Determine what variables to measure and how to collect the data
Variables are properties or attributes of the individuals in the population that can be measured. To obtain data, a sample of the population must be chosen and the variables that are important to the situation should be recorded for each individual in the sample.
It is important that the sample be representative of the population and that it not be subject to bias. Bias is introduced when some part of the population is over or underrepresented.
To answer the question, the variables should include the amounts of each kind of produce being purchased.
An appropriate sampling method would be to go to each of the grocery stores in the city and survey a random sample of the people making purchases at the store.
Since the growing season is limited to a particular time of year, the survey should be conducted during a time when the crops would be available from the farmers.
Analyze the data
Analysis of the data involves calculating appropriate summaries for the variables. For numeric variables, this includes calculating averages and typical ranges for the variable. For other variables, the summaries may involve charts of the distribution of the values.
Since the quantity of produce purchased is a numeric variable, it would be appropriate to create summaries of the average amounts and their ranges. It would also be helpful to the farmers to see the relative percentages of each kind of produce, so charts showing the distribution of different kinds of produce should be created.
Draw conclusions
When a sample is randomly selected without bias, then it should be representative of the population. For reasonably large sample sizes, the results should be generalizable to the population.
The sampling method here used randomly selected shoppers at the stores in the city, so the result should be representative of the population. The results should be generalizable to all shoppers.
Evaluate the sampling method
Question
When collecting the data, you choose a Saturday morning and send a person to each of the five stores in the city. You have them use a die to choose the people to interview by rolling the die each time a person leaves the store and only interviewing a person if the roll is a 1. Will this method produce a random sample that is representative of the population?
Activity 3
Question
A statistics student is doing a project for her class. She wants to make a prediction for the outcome of an upcoming national election. Since there are only two candidates, she decides that her question is “Which candidate do more people favor in the upcoming election?” She decides to randomly interview 100 students crossing the courtyard on campus about their preference. Is this sample good for drawing general conclusions about the results of the election?
Activity 4
Question
In the description of the following experiment, determine the experimental factor. A pharmaceutical company conducted an experiment to test a breakfast drink for school children. The company enrolled students for the experiment in the age group of 6 to 10 and divided them into two groups. One group received the new breakfast drink with their normal breakfast, and the other group drank the same amount of a similar-looking juice. Identify the experimental factor.
Activity 5
Question
A candy manufacturer is interested in the distribution of colors in each of its packages of candy sold. What should the researchers do first?
Activity 6
Question
A researcher wants to find out the effect of the amount of protein eaten at breakfast on the aerobic performance of runners. Would an experimental or observational study design be more appropriate?
Activity 7
Question
In the description of the following experiment, determine the experimental factor.
A research team is testing a product that will minimize wrinkles among older adults. Volunteers in the age group of 40 to 45 are included in the research. The research team gives a cream to be applied on the face to one group and a placebo cream to the other group.
Activity 8
Question
A scientist is interested in finding out the effect of soil quality on crop yield. Would an experimental or observational study design be more appropriate?
Activity 9
Question
A researcher is interested in the effects of watching videos just before bed on the quality of sleep. He has decided to test the claim that “Watching 1 hour of video just before going to bed reduces the number of minutes of REM sleep by more than 10%. ” Which of the following data collection processes would be appropriate? Select only one answer choice.
Activity 10
Question
A consumer research company is interested in determining if a certain company’s new refrigerator model is more efficient than the older model. Researchers decided to investigate the claim that the new model uses 10% less electricity than the older model for the same cooling load. To collect data, the company obtains 20 random refrigerators for each model. They are all placed in one building well separated from each other and are loaded with 50 bottles of water. The electricity usage is monitored for one month. How can the results be generalized?
Activity 11
Question
A researcher wants to evaluate the effect of using Facebook on happiness. Would an experimental or observational study design be more appropriate?
Activity 12
Question
A researcher is interested in seeing if there is a relationship between the use of a particular software program and age of the user. The researcher conducts a survey of adults in which she categorizes the respondents into one of two categories, either 18−35years old, or 35 years and older.
Is the study described observational or experimental? If it is an experiment, what is the controlled factor?
Activity 13
Question
In the description of the following experiment, determine the experimental factor. During a study testing a new vaccine drug for the Zika virus, the research team grouped the volunteers enrolled for the test into Group A and Group B. Group A received an inert drug (placebo) while Group B received the vaccine drug.
Activity 14
Question
In the description of the following experiment, determine the experimental factor. A research team is testing a paste form of a drug to alleviate inflammation. Participants are grouped into Team A and Team B. Team A receives the paste form of the drug. Team B receives a similar paste with no active ingredients.
Week 1 Assignment: Variables and Measures of Data
Objectives
1.2 Variables and Measures of Data
Completed
- Identify explanatory and response variables in an experiment
- Define and distinguish between qualitative, quantitative, discrete, and continuous variables
- Identify levels of measurement of data
Activity 1
Question
A market researcher finds the price of several brands of fabric softener. What is the level of measurement of the data?
Activity 2
Question
At a comic convention, a researcher asks attendees what their favorite comic book is. What is the level of measurement of the data?
Activity 3
Question
Is the statement below true or false?
Continuous data is the type of quantitative data that is the result of counting.
Activity 4
Question
What is an attribute whose value is indicated by a label?
Activity 5
Question
Thomas is investigating if gender has any effect on political party associations. Which of the following gives the explanatory and response variables respectively?
Activity 6
Question
Tina has created an experiment to test whether or not age has any effect on the number of words on a list that can be remembered. What is the explanatory variable in this situation?
Activity 7
Question
True or False?
An explanatory variable is a value or component of the independent variable applied in an experiment.
Activity 8
Question
Which of the following best describes the term explanatory variable?
Activity 9
Question
Given that Justin is collecting data on reaction time, what type of data is he working with?
Activity 10
Question
Patrick is collecting data on shoe size. What type of data is this?
Activity 11
Question
A track runner keeps track of how long it takes her to run the 200-meter dash. What is the level of measurement of the data?
Activity 12
Question
A new mother keeps track of the time when her baby wakes up each morning. What is the level of measurement of the data?
Week 1 Discussion: Basic Statistics Data Used in Everyday Life
Discussion Prompt
Required Resources
Read/review the following resources for this activity:
- OpenStax Textbook: Chapter 1
- Lesson 1 Reading
- Minimum of 1 scholarly source
In your reference for this assignment, be sure to include both your text/class materials AND your outside reading(s).
Initial Post Instructions
- Present two different types of data, or variables, used in the health field. Examples could be blood pressure, temperature, pH, pain rating scales, pulse oximetry, % hematocrit, minute respiration, gender, age, ethnicity, etc.
- Classify each of your variables as qualitative or quantitative and explain why they fall into the category that you chose.
- Also, classify each of the variables as to their level of measurement–nominal, ordinal, interval or ratio–and justify your classifications.
- Which type of sampling could you use to gather your data? (stratified, cluster, systematic, and convenience sampling)
Follow-Up Post Instructions
Respond to at least one peer. Further the dialogue by providing more information and clarification.
Your responses to other students can explain additional analyses that could be done with the variables they selected. Consider confounding variables, discrete or continuous data, the effects of outliers, etc.
Writing Requirements
- Minimum of 2 posts (1 initial & 1 follow-up)
- APA format for in-text citations and list of references
Week 1 Assignment: Sampling Methods
Objectives
1.3 Sampling Methods
- Understand the definitions of population, sample, statistic, parameter, and data
Activity 1
Question
Joseph wants to estimate the mean number of siblings for each student in his school. He records the number of siblings for each of 200 randomly selected students in the school. What is the sample?
Activity 2
Question
What term refers to all individuals, objects, or measurements whose properties are being studied?
Activity 3
Question
Is the statement below true or false?
Data is a subset of the population studied.
Activity 4
Question
Raymond wants to estimate the percentage of parents who use cloth diapers. He asks a randomly selected group of 200 parents whether or not they use cloth diapers. What is the parameter?
Answer
Activity 5
Question
Angela wants to estimate the mean number of siblings for each student in her school. She records the number of siblings for each of 200 randomly selected students in the school. What is the data?
Week 1 Assignment: Comparing Sampling Methods
Objectives
1.4 Comparing Sampling Methods
- Identify and distinguish between stratified, cluster, systematic, and convenience sampling
- Determine appropriate sampling methods
Activity 1
Identify and Distinguish Between Stratified, Cluster, Systematic, and Convenience Sampling
Types of Sampling
A sample should have the same characteristics as the population it is representing. Most statisticians use various methods of random sampling in an attempt to achieve this goal. There are several different methods of random sampling. In each form of random sampling, each member of a population initially has an equal chance of being selected for the sample.
A simple random sample is a sample selected from a population in a way such that all combinations of members of the population of that size have the same chance of being selected. However, a true simple random sample can sometimes be difficult to obtain. Additionally, researchers may sometimes wish to ensure that some distinguishable characteristic of members in the population is not overrepresented or underrepresented in their sample, as could occur by chance with a simple random sample. Beyond simple random sampling, well-known random sampling methods include stratified sampling, cluster sampling, and systematic sampling.
To choose a stratified sample, you should divide the population into groups, and then take your sample from a proportionate number from each group.
Example
To choose a stratified sample of all students at your college, you could group all the students by the schools they belong to – Liberal Arts, Engineering, Journalism, or Business. To choose a simple random sample from each school, you could number each student in the Liberal Arts school, number each student in the Engineering school, and do the same for the remaining schools.
Then you would randomly choose a proportionate number of students from the Liberal Arts school, the Engineering school, the Journalism school, and the Business school. The combination of all students randomly chosen from each of these schools is the stratified sample.
To choose a cluster sample, divide the population into groups, and then randomly select some of the groups. All the members from these chosen groups are in the cluster sample.
Example
To choose a cluster sample of all students at your college, you could cluster all the students into their majors. You could number these majors (clusters), and then randomly choose five majors using simple random sampling. All students from these five majors make up the cluster sample.
To choose a systematic sample, randomly select a starting point and take every nth piece of data from a listing of the population. Systematic sampling is frequently chosen because it is a simple method.
Example
Suppose you have to do a phone survey, and you want a systematic sample. Your phone book contains 20,000 residence listings. You must choose 400 names for the sample. Number the population 1–20,000 and then use a simple random sample to pick a number that represents the first name in the sample. Then choose every 15th name thereafter until you have a total of 400 names. (You might have to go back to the beginning of your phone list.) Every person in that list of 400 names is in the systematic sample.
Activity 2
Question
True or False? Stratified sampling was used in the scenario below.
A random number generator is used to select a student from the alphabetical listing of all undergraduate students in the Fall semester. Starting with that student, every 50th student is chosen until 75 students are included in the sample.
Activity 3
Identify and Distinguish Between Stratified, Cluster, Systematic, and Convenience Sampling
Convenience Sampling
A type of sampling that is not random is convenience sampling. (Stratified, cluster and systematic sampling are all random.) Convenience sampling involves using results that are readily available.
For example, a computer software store conducts a marketing study by interviewing potential customers who happen to be in the store browsing through the available software. The results of convenience sampling may be very good in some cases and highly biased (favor certain outcomes) in others. Sampling data should be done very carefully. Collecting data carelessly can have devastating results.
Activity 4
Question
Which of the following sampling scenarios describe convenience sampling?
Activity 5
Types of Sampling
Types of Sampling
A random sample is one in which each individual in the population has an equal chance of being selected for the sample. A simple random sample is a sample selected from a population in a way such that all combinations of members of the population of that size have the same chance of being selected.
This video will define and contextualize sampling methods, including convenience sampling, systematic sampling, cluster sampling, and stratified sampling.
Activity 6
Question
Annie wants to estimate the average number of AP classes a student at her high school takes. She decides to randomly select 6 classes and use all the students in those 6 classes to estimate the average.
What type of sampling did Annie use?
Activity 7
Question
Sneha wants to inspect the cleanliness of the rooms in a hotel. There are 10 floors in the hotel and each floor has 20 rooms. From each floor, she randomly selects 2 rooms and inspects them.
What type of sampling did Sneha use?
Activity 8
Identify and Distinguish Between Stratified, Cluster, Systematic, and Convenience Sampling
Types of Sampling
A sample should have the same characteristics as the population it is representing. Most statisticians use various methods of random sampling in an attempt to achieve this goal. There are several different methods of random sampling. In each form of random sampling, each member of a population initially has an equal chance of being selected for the sample.
A simple random sample is a sample selected from a population in a way such that all combinations of members of the population of that size have the same chance of being selected. However, a true simple random sample can sometimes be difficult to obtain. Additionally, researchers may sometimes wish to ensure that some distinguishable characteristic of members in the population is not overrepresented or underrepresented in their sample, as could occur by chance with a simple random sample. Beyond simple random sampling, well-known random sampling methods include stratified sampling, cluster sampling, and systematic sampling.
To choose a stratified sample, you should divide the population into groups, and then take your sample from a proportionate number from each group.
Example
To choose a stratified sample of all students at your college, you could group all the students by the schools they belong to – Liberal Arts, Engineering, Journalism, or Business. To choose a simple random sample from each school, you could number each student in the Liberal Arts school, number each student in the Engineering school, and do the same for the remaining schools.
Then you would randomly choose a proportionate number of students from the Liberal Arts school, the Engineering school, the Journalism school, and the Business school. The combination of all students randomly chosen from each of these schools is the stratified sample.
To choose a cluster sample, divide the population into groups, and then randomly select some of the groups. All the members from these chosen groups are in the cluster sample.
Example
To choose a cluster sample of all students at your college, you could cluster all the students into their majors. You could number these majors (clusters), and then randomly choose five majors using simple random sampling. All students from these five majors make up the cluster sample.
To choose a systematic sample, randomly select a starting point and take every nth piece of data from a listing of the population. Systematic sampling is frequently chosen because it is a simple method.
Example
Suppose you have to do a phone survey, and you want a systematic sample. Your phone book contains 20,000 residence listings. You must choose 400 names for the sample. Number the population 1–20,000 and then use a simple random sample to pick a number that represents the first name in the sample. Then choose every 15th name thereafter until you have a total of 400 names. (You might have to go back to the beginning of your phone list.) Every person in that list of 400 names is in the systematic sample.
Activity 9
Question
True or False? Stratified sampling was used in the scenario below.
A random number generator is used to select a student from the alphabetical listing of all undergraduate students in the Fall semester. Starting with that student, every 50th student is chosen until 75 students are included in the sample.
Activity 10
Identify and Distinguish Between Stratified, Cluster, Systematic, and Convenience Sampling
Convenience Sampling
A type of sampling that is not random is convenience sampling. (Stratified, cluster and systematic sampling are all random.) Convenience sampling involves using results that are readily available.
For example, a computer software store conducts a marketing study by interviewing potential customers who happen to be in the store browsing through the available software. The results of convenience sampling may be very good in some cases and highly biased (favor certain outcomes) in others. Sampling data should be done very carefully. Collecting data carelessly can have devastating results.
Activity 11
Question
Which of the following sampling scenarios describe convenience sampling?
Answer
Activity 12
Question
A television station plans to send a crew to a polling center on an election day. Because they do not have time to interview each voter, they decide to count voters leaving the polling location and ask every 20th voter for an interview. What type of sampling is this?
Activity 13
Question
A professor is interested in the average length of books in her library. She has divided her books into a few different categories: 235 books on mathematics, 290 books on sports, and 166 books on interior design. Rather than examining all the books, she plans to use a stratified sample of 50 books. How many sportsbooks should she choose? Enter a whole number.
Activity 14
Question
In order to study the wrist sizes of people in her town, Kathryn samples the population by dividing the residents by age and randomly selecting a proportionate number of residents from each age group. Which type of sampling is used?
Activity 15
Question
The management of a large airline wants to estimate the average time after takeoff taken before the crew begins serving snacks and beverages on their flights. Assuming that management has easy access to all of the information that would be required to select flights by each proposed method, which of the following would be reasonable methods of stratified sampling? Select all that apply.
Activity 16
Question
Donald is studying the eating habits of all students attending his school. He samples the population by dividing the students into groups by grade level and randomly selecting a proportionate number of students from each group. He then collects data from the sample. Which type of sampling is used?
Activity 17
Question
An executive for a large national restaurant chain with multiple locations in each of 513 counties wants to personally sample the cleanliness of the chain’s restaurants throughout the country by visiting restaurants. The executive wants a good-quality sample but wants to minimize travel time and expenses. Which of the following sampling methods would be most appropriate?
Activity 18
Question
When is cluster sampling appropriate?
Activity 19
Question
A town planner is interested in getting some demographic data about the households in the city. The city has four wards with the following numbers of households: ward A has 2,107, ward B has 903, ward C has 1,505, and ward D has 1,499. The budget for the project allows the planner to survey 100 households. She plans to use a stratified sampling method. What number of households should be chosen from ward B? Enter a whole number.
Week 2 – Graphing and Describing Data
| Week | Assignments | Due Date |
| Week 2 | Graded Discussion | Due Date— Responses: Sunday of Week 2 [Have two posts on two different days] |
| Knewton Homework Assignments Frequency Tables (Section 2.1)Frequency Tables & Histograms (Section 2.1) Stem & Leaf (Section 2.1) Line & Bar Graphs (Section 2.1) | Sunday of Week 2 | |
| Knewton Quiz #1 Covers Week 1 – 2 Material 25 Questions 2 Attempts | Sunday of Week 2 |
————
Week 2 Discussion: Graphing and Describing Data in Everyday Life
Discussion prompt
Read/review the following resources for this activity:
- OpenStax Book: Chapter 2—Section 2.1
- Lesson
- Minimum of 1 scholarly source
In your reference for this assignment, be sure to include both your text/class materials AND your outside reading(s).
Initial Post Instructions
Suppose that you have two sets of data to work with. The first set is a list of all the injuries that were seen in a clinic in a month’s time. The second set contains data on the number of minutes that each patient spent in the waiting room of a doctor’s office. You can make assumptions about other information or variables that are included in each data set.
For each data set, propose your idea of how best to represent the key information. To organize your data would you choose to use a frequency table, a cumulative frequency table, or a relative frequency table? Why?
What type of graph would you use to display the organized data from each frequency distribution? What would be shown on each of the axes for each graph?
Follow-Up Post Instructions
Respond to at least one peer. Further the dialogue by providing more information and clarification.
Consider how different distributions might affect the different graphs. How might other variables affect the graphs? How could graphs be made to be biased? If a graph were biased, how might you change it to guard against that bias?
Writing Requirements
- Minimum of 2 posts (1 initial & 1 follow-up)
- APA format for in-text citations and list of references
Week 2 Assignment: Frequency Tables
Objectives
2.1 Frequency Tables
- Constructing and understanding frequency tables for a set of data, given class limits
- Construct and understand cumulative relative frequency tables for a set of data
Activity 1
Question
William wishes to view a frequency table for grouped data using his monthly credit card statements for the last 20 months, shown below. Construct the table for William using six classes. 1184, 1247, 945, 1124, 1034, 1352, 1025, 1439, 1136, 1439, 1368, 1057, 1130, 1259, 1256, 1381, 838, 1342, 842, 1395
Activity 2
Question
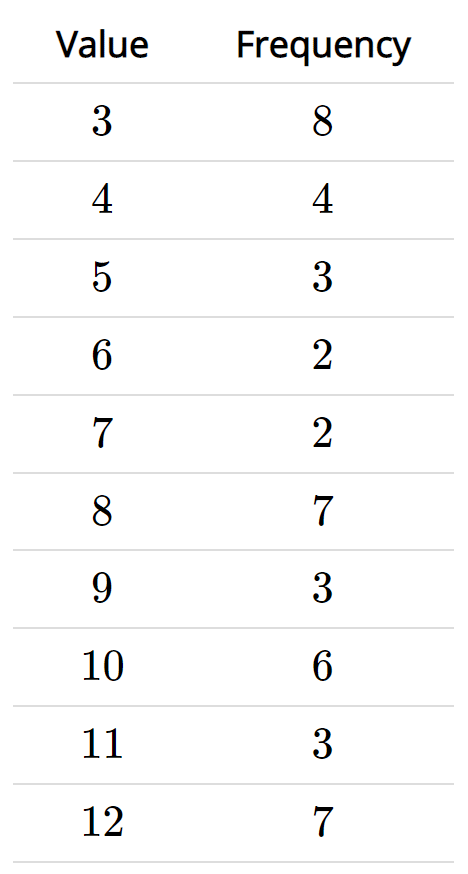
A data set is summarized in the frequency table below. Using the table, determine the number of values less than or equal to 7 in the data set. Give your answer as a single number. For example if you found the number of values was 16, you would enter 16.
Activity 3
Question
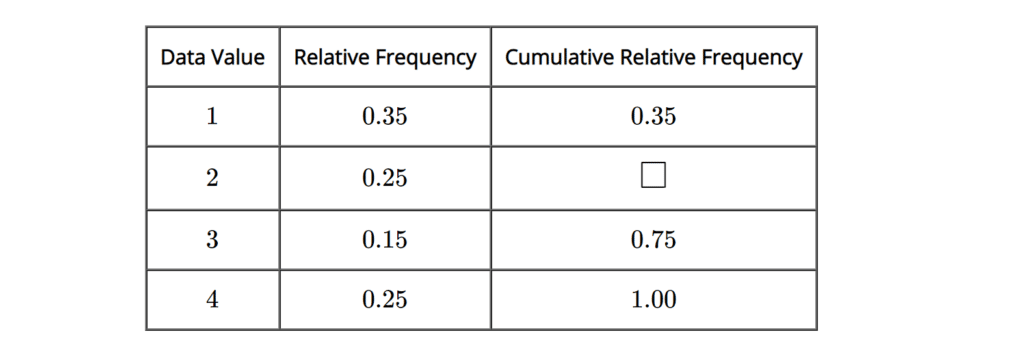
The cumulative relative frequency table for a set of data is shown below.
What is the missing cumulative relative frequency?
Activity 4
Question
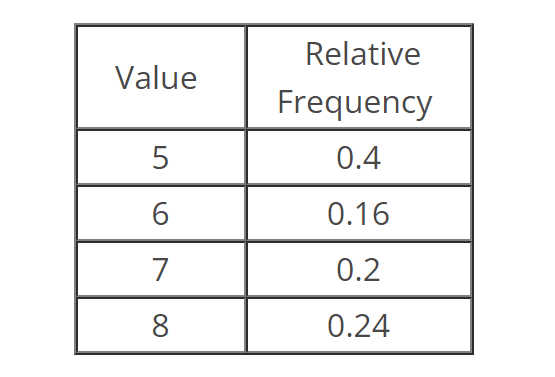
Given the relative frequency table below, which of the following is the corresponding cumulative relative frequency table?
Activity 5
Question
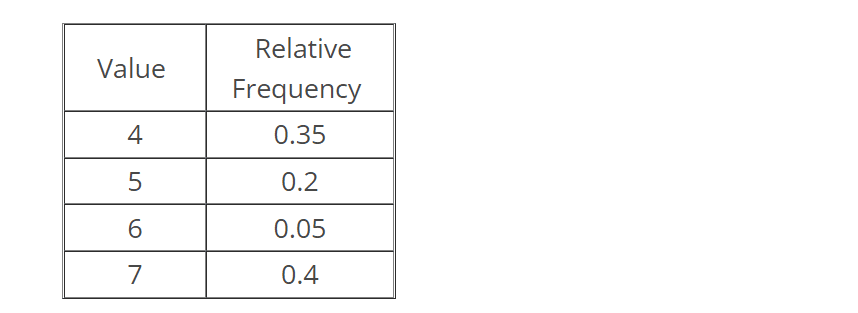
Given the relative frequency table below, which of the following is the corresponding cumulative relative frequency table?
Activity 6
Question
William wishes to view a frequency table for grouped data using his monthly credit card statements for the last 20 months, shown below. Construct the table for William using six classes. 1312, 1303, 809, 1477, 1263, 1444, 894, 1051, 1485, 1433, 1132, 1221, 1179, 945, 995, 1179, 1172, 1373, 906, 955
Activity 7
Question
A small startup company wishes to know how many hours, per week, that its employees spend commuting to and from work. The number of hours for each employee are shown below. Construct a frequency table for grouped data using four classes. 9, 18, 18, 14, 13, 4, 12, 9, 13, 10, 20, 12, 19, 20, 13, 3, 5, 20, 17, 1
Activity 8
Question
Given the relative frequency table below, which of the following is the corresponding cumulative relative frequency table?
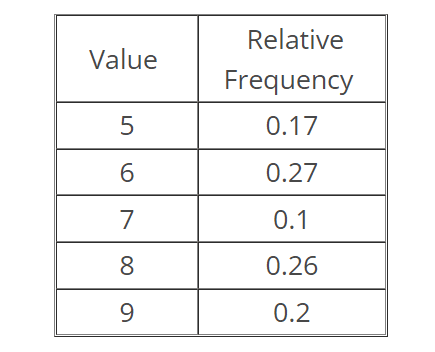
Week 2 Assignment: Frequency Tables and Histograms
Objectives
2.2 Frequency Tables and Histograms
- Create and interpret histograms
- Identify and label shapes of histograms
Activity 1
Question
Given the following frequency distribution table for a set of data about the time spent writing an email (in minutes) for all employees at a small company, construct a histogram that accurately summarizes the data.
| Writing an Email (in minutes) | Frequency |
| 6.5-8.5 | 1 |
| 8.5-10.5 | 3 |
| 10.5-12.5 | 4 |
| 12.5-14.5 | 6 |
| 14.5-16.5 | 5 |
| 16.5-18.5 | 7 |
Create the corresponding histogram to represent this data below. Drag the dots on the top of the histogram to create the chart.
Activity 2
Question
According to the histogram, which range of minutes contains the highest frequency for time spent writing an email?
Activity 3
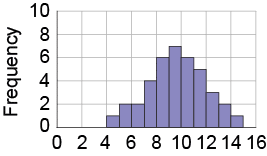
Question
Describe the shape of the given histogram.
Activity 4
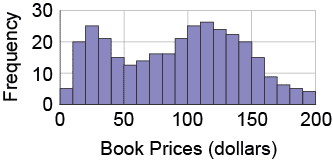
Question
A bookstore took an inventory of the prices of its books and created a histogram to show the results. What shape does the distribution have?
Activity 5
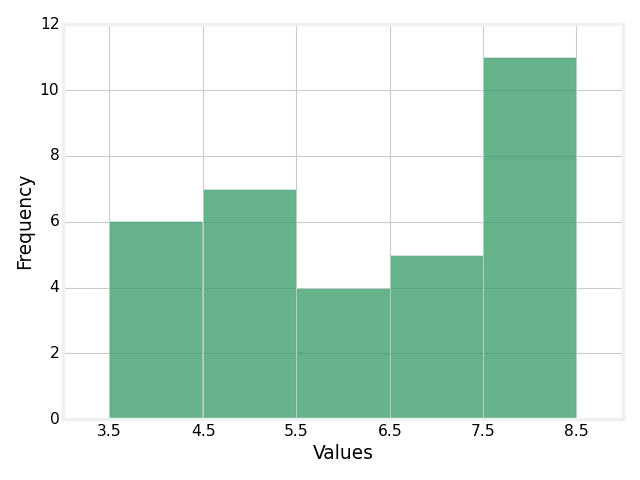
Question
Several people were asked to report the number of hours of sleep they average per night. The results are shown in the histogram below. How many of those people average greater than 4.5 and less than 6.5 hours of sleep per night?
Activity 6
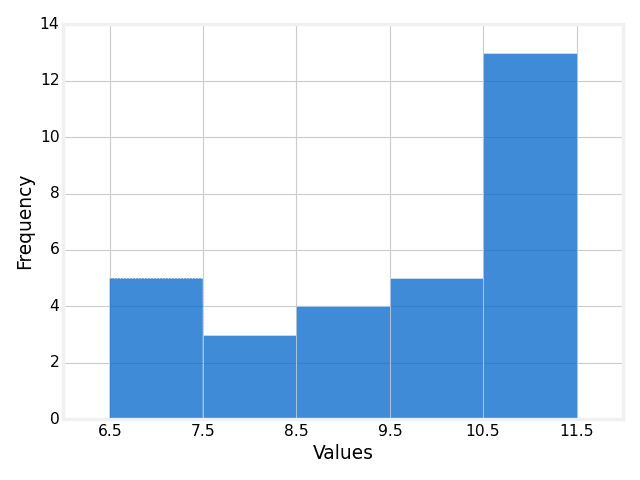
Question
The speed (in mph) of randomly selected bicyclists were measured as they were approaching a hill. The results are presented in the following histogram.
How many of those bicyclists were traveling at least 8.5 and less than 11.5 mph as they were approaching the hill?
Activity 7
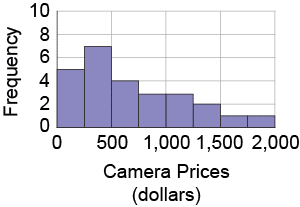
Question
The histogram below represents the prices of digital SLR camera models at a store. Describe the shape of the distribution.
Activity 8
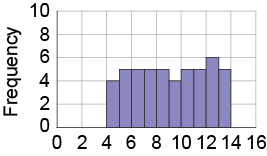
Question
Describe the shape of the given histogram.
Week 2 Assignment: Stem and Leaf plots
Objectives
2.5 Dot Plots and Stem and Leaf plots
- Create and interpret stem-and-leaf plots
Activity 1
Question
A set of data is summarized by the stem and leaf plot below.
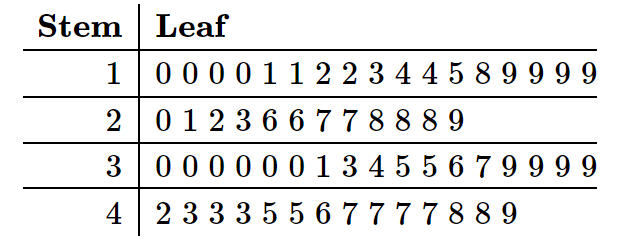
Which of the following statements are true? Select all correct answers.
Activity 2
Question
A set of data is summarized by the stem and leaf plot below.

Activity 3
Question
A set of data is summarized by the stem and leaf plot below.

Activity 4
Question
A set of data is summarized by the stem and leaf plot below.

Week 2 Assignment: Line and Bar Graphs
Objectives
2.6 Line and Bar Graphs
- Create and interpret bar graphs
- Create and interpret line graphs of data
Activity 1
Question
The bar graph below shows the number of boys and girls in different classes.
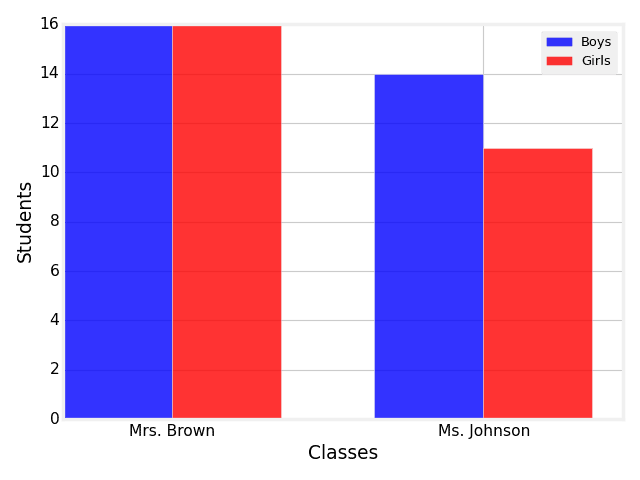
A side-by-side bar chart has a horizontal axis labeled Classes with teachers Mrs. Brown and Ms. Johnson and a vertical axis labeled Students from 0 to 16 in increments of 2. There are two vertical bars above each horizontal teacher label, with the bar on the left representing Boys and the bar on the right representing Girls. The heights of the bars are as follows, where the teacher is listed first, and the heights of the bars are listed next from left to right: Mrs. Brown, 16 and 16; Ms. Johnson, 14 and 11.
What is the total number of boys across all the classes shown? Do not include the units in your answer.
Activity 2
Question
The data listed below represent the number of TVs in a house by family size.
| Family Size | Number of TVs |
| 2 | 1 |
| 3 | 2 |
| 4 | 3 |
| 6 | 6 |
| 8 | 6 |
Create the corresponding line graph to represent this data below.
Make sure to drag the points according to the x values in ascending order, to avoid overlapping segments of the line, as this can be marked incorrect.
Activity 3
Question
According to the information above, what family sizes have 6 TVs in their household?
Activity 4
Question
A movie theater is researching its customer’s favorite movie genres. The following table shows the favorite movie genres of the selected customers.
| Movie Genre | Frequency |
| Comedy | 7 |
| Romance | 3 |
| Science Fiction | 6 |
| Action | 6 |
| Drama | 5 |
Create the corresponding bar graph to represent this data below. Drag the dots on the top of the bar graph to create the chart.
Activity 5
Question
Which movie genre was selected as the most popular by the sampled movie theater customers?
Activity 6
Question
A travel agency is conducting research on how many times families went on vacation during the last year. The following table shows the number of times sampled families went on vacation.
| Vacation | Frequency |
| None | 3 |
| Once | 11 |
| Twice | 9 |
| Three times | 6 |
| Four times | 3 |
Create the corresponding bar graph to represent this data below. Drag the dots on the top of the bar graph to create the chart.
Activity 7
Question
According to the given data, what can the travel agency conclude about the sampled families?
Activity 8
Question
Josslyn is a car salesperson who keeps track of her sales over time. The line graph below shows how many cars she sells per week.
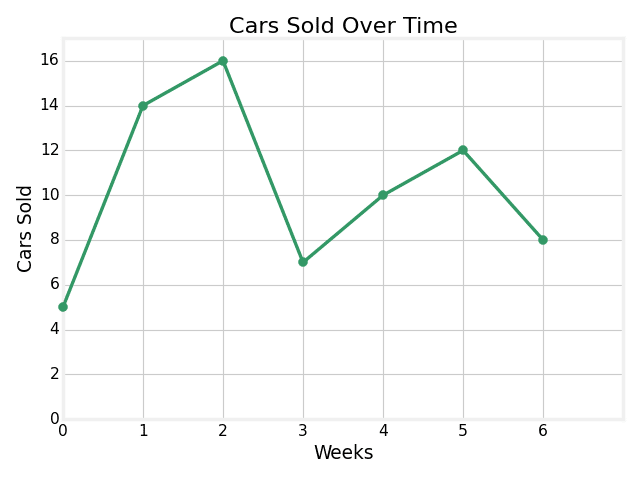
What was the change in cars sold from week 2 to 6? Do not include the unit in your answer.
Activity 9
Question
Marc is keeping track of the total number of movies he has watched over time. The line graph below shows the data, where the vertical axis corresponds to the total number of movies that had been watched since day 0 by the beginning of the week shown on the horizontal axis.
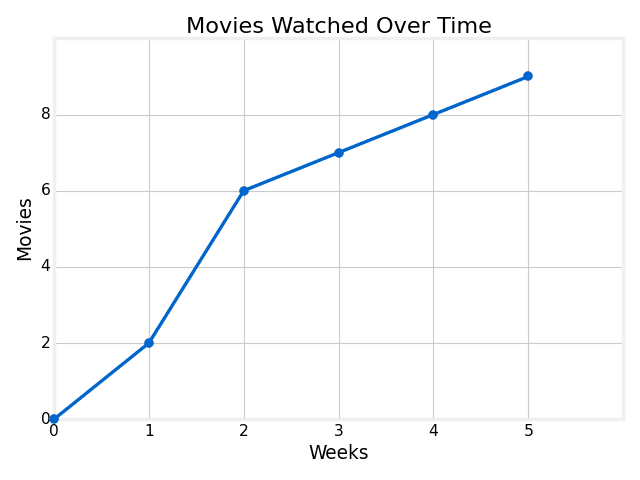
How many movies did Marc watch between the beginning of week 1 and the beginning of week 5? Do not include the unit in your answer.
Week 3: Measures of Central Tendency and Variation
| Week | Assignments | Due Date |
| Week 3 | Graded Discussion | Suggested Due Date— Initial Post: Wednesday of Week 3 Due Date— Responses: Sunday of Week 3 [Have two posts on two different days] |
| Knewton Homework Assignments Measures of Central Tendency (Section 2.3) Understanding Measures of Central Tendency (Section 2.3 & 2.4) Distribution Shape (Section 2.6)Standard Deviation (Section 2.7) Quartiles and Box Plots (Section 2.2) | Sunday of Week 3 | |
| Lab #1—Displaying Data | Sunday of Week 3 |
————
Week 3 Discussion: Measures of Central Tendency and Variation
Discussion prompt
Understanding descriptive statistics, their measures of center and their variability, helps form the foundation of statistical analysis. Descriptive statistics tell us how frequently an observation occurs, what is considered average, and how far data in our sample deviate from being average. With these statistics, we are able to provide a summary of characteristics from both large and small datasets. Measures of central tendency and variability provide valuable information on their own, and form the cornerstone of the quantitative structures that we build in our research studies.
Required Resources
Read/review the following resources for this activity:
- OpenStax Textbook: Chapter 2
- Lesson
- Minimum of 1 scholarly source
In your reference for this assignment, be sure to include both your text/class materials AND your outside reading(s).
Initial Post Instructions
For this Discussion, you will examine central tendency and variability in terms of pulse rate.
Find and record the pulse rate of 10 different people where you work. Tell us a little about the population from which you drew your data. Describe your findings in terms of central tendency and variability.
Consider using some of the following to help you form your initial discussion post:
What are your measures of central tendency (i.e., mean, median, and mode)? Which might be the better measure for central tendency and why?
What is the standard deviation of your data? How variable are the data (range)?
Are there any outliers? Investigate possible reasons for these outliers, and things that might limit them if further study were to be carried out.
What are some variables that should be considered in discussing your measures of central tendency and variation? Is there any skewness in your measured data?
How would you describe this data (i.e. what insights did you gain from this data)?
Follow-Up Post Instructions
Respond to at least one peer. Further the dialogue by providing more information and clarification.
Writing Requirements
- Minimum of 2 posts (1 initial & 1 follow-up)
- APA format for in-text citations and list of references
Week 3 Assignment: Measures of Central Tendency
Objectives
3.1 Measures of Central Tendency
- Find the mean of a set of data
- Find the median of a set of data
- Find the mode of a set of data
Activity 1
Question
Find the mode of the following hourly wages (in dollars) of randomly selected employees at an accounting office.
15,15,18,15,11,18,7,17,17,7
Activity 2
Question
The football coach wants to know the average number of points scored by the team in their last few games. The scores are listed below.
29,17,39,40,24,25,19,23
Find the mean points scored.
Activity 3
Question
Find the mode of the following number of chocolates eaten by each guest at a birthday party.
11,14,12,14,10,12,10,10,12,12,11,6
Activity 4
Question
The basketball coach wants to know the average number of points scored by the team in their last few games. The scores are listed below.
47,57,52,56
Find the mean points scored.
Activity 5
Question
Given the following list of data, find the median.
22,33,17,8,17,29,18,13,26,28
Activity 6
Question
Find the median of the following list of dollars spent per customer at a deli in the last hour.
21,7,13,8,16,30,10
Activity 7
Question
Find the median of the following set of data.
32,19,21,16,27,15
Activity 8
Question
Given the following list of data, find the median.
1,3,1,23,2,4,22,13,26,8
Activity 9
Question
An art collector bought 20 paintings at an art fair and wants to know the average price of the paintings she purchased at the fair. She adds the prices of all the paintings and divides this number by 20 to find an average price of $350. Is this price a sample mean or a population mean, and which symbol would be used to denote it?
Activity 10
Question
A teacher randomly selects 10 out of her 30 students and finds that the mean height of those 10 students is 5′2″. Is this a sample mean or a population mean, and which symbol would be used to denote it?
Activity 11
Question
Find the mode of the following number of paper clips found by each participant during a scavenger hunt.
15,12,20,19,20,15,7,12,7,19,15
Activity 12
Question
Each person in a group shuffles a deck of cards and keeps selecting a card until an ace appears. Find the mode of the following number of cards drawn from a deck until an ace appears.
14,10,7,14,9,9,10,12,9,7,12
Week 3 Assignment: Understanding Measures of Central Tendency
Objectives
3.2 Impact of Outliers on measures of Central Tendency
- Identify the effect of outliers on measures of central tendency
Activity 1
Question
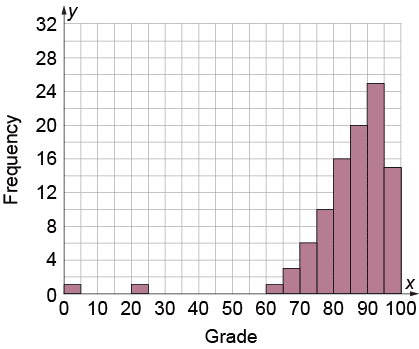
The following histogram represents the grades of all of a teacher’s students on a recent test. What would be the best measure of central tendency for this data set?
Activity 2
Question
The following data set represents the number of times students have been late to their math class.
0, 0, 1, 0, 0, 2, 0, 1, 1, 0, 0, 0, 0, 3, 0, 0, 2
Suppose that the last value, 2, was mistakenly recorded as 20. What measure(s) of the typical value in a data set would be affected by this error? Select all that apply.
Activity 3
Question
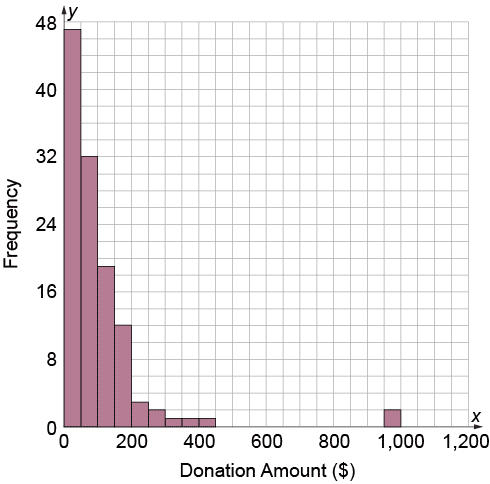
The following histogram shows the dollar amounts of donations collected by a charitable organization over the course of a month. Identify the best measure of central tendency for this data set.
Activity 4
Question
The following data set represents the math test scores for a class of 20 students.
90, 85, 95, 100, 100, 90, 100, 65, 100, 85, 80, 95, 80, 100, 85, 75, 100, 90, 90, 75
Would the mode be a good measure of central tendency for this data set?
Week 3 Assignment: Distribution Shape
Objectives
3.3 Distribution Shape
Completed
- Determine if a data set is skewed
Activity 1
Question
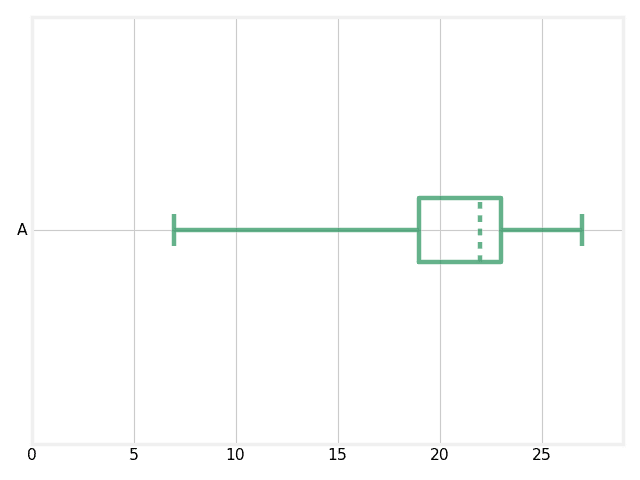
Given the following box-and-whisker plot, decide if the data is skewed or symmetrical.
Activity 2
Question
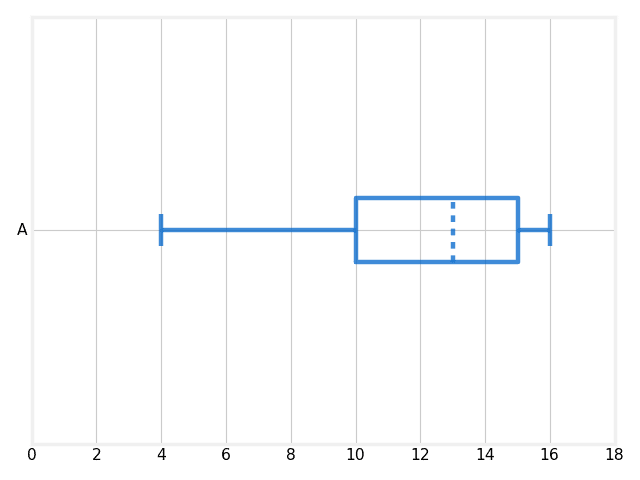
Given the following box-and-whisker plot, decide if the data is skewed or symmetrical.
Activity 3
Question
Which of the following frequency tables show a skewed data set? Select all answers that apply
Activity 4
Question
Which of the following histograms shows a skewed data set?
Week 3 Assignment: Standard Deviation
Objectives
3.4 Standard Deviation
- Compute variance and standard deviation
- Understand the standard deviation of a set of data
Activity 1
Question
Which of the following lists of data has the smallest standard deviation?
Activity 2
Question
For the following dataset, you are interested to determine the “spread” of the data.
Would you employ calculations for the sample standard deviation, or population standard deviation for this dataset:
Ages of all students in a Statistics course with an enrollment of 30 students.
Activity 3
Question
The data below are the heights in feet of five trees from a plant nursery. Find the sample variance of the height.
6, 8, 7, 11, 3.
- Round the final answer to one decimal place.
Activity 4
Question
Using the following set of data (the same as in the previous problem), find the sample standard deviation of the heights of the trees: 6, 8, 7, 11, 3.
The sample variance of this data set is 8.5.
- Round the final answer to one decimal place.
Activity 5
Question
Which of the data sets represented by the following histograms has the smallest standard deviation?
Activity 6
Question
Which of the data sets represented by the following histograms has the smallest standard deviation?
Activity 7
Question
The data sets below include four random samples of pulse rates, in beats per minute, for 7 individuals. Use the range rule of thumb to find an estimate for the standard deviation, then determine which sample has the smallest amount of variation.
| Sample 1 | 64,78,54,102,76,86,56 |
| Sample 2 | 100,90,70,70,78,70,94 |
| Sample 3 | 70,66,50,72,66,64,54 |
| Sample 4 | 78,36,102,68,66,56,70 |
Activity 8
Question
The following data values represent the daily amount spent by a family during a 7 day summer vacation.
Find the sample standard deviation of this dataset:
$96, $125, $80, $110, $75, $100, $121
- Round the final answer to one decimal place.
Activity 9
Question
The following data values represent the daily amount spent by a family during a 7 day summer vacation.
Find the population standard deviation of this dataset:
$96,$125,$80,$110,$75,$100,$121
(Round your answer to 1 decimal place).
Week 3 Assignment: Quartiles and Box Plots
Objectives
3.5 Quartiles and Box Plots
- Find the five-number summary of a data set
- Identify the interquartile range and potential outliers in a set of data
- Construct and understand box-and-whisker plots
Activity 1
Question
The following frequency table summarizes a set of data. What is the five-number summary?
| Value | Frequency |
| 3 | 1 |
| 4 | 3 |
| 6 | 3 |
| 8 | 1 |
| 9 | 3 |
| 10 | 2 |
| 11 | 2 |
| 12 | 1 |
| 14 | 3 |
Activity 2
Question
Given the following frequency table of data, what is the potential outlier?
| Value | Frequency |
| 8 | 1 |
| 9 | 0 |
| 10 | 0 |
| 11 | 0 |
| 12 | 0 |
| 13 | 0 |
| 14 | 0 |
| 15 | 0 |
| 16 | 1 |
| 17 | 4 |
| 18 | 10 |
| 19 | 4 |
| 20 | 6 |
| 21 | 2 |
| 22 | 3 |
Activity 3
Question
The five-number summary for a set of data is given below.
| Min | Q1 | Median | Q3 | Max |
| 54 | 55 | 64 | 67 | 96 |
What is the interquartile range of the set of data?
Enter just the number as your answer. For example, if you found that the interquartile range was 20, you would enter 20.
Activity 4
Question
The five number summary for a set of data is given below.
| Min | Q1 | Median | Q3 | Max |
| 50 | 63 | 70 | 79 | 96 |
Using the interquartile range, which of the following are outliers? Select all correct answers.
Activity 5
Question
A data set lists the number of lab notes written by students during a biology lab. For this data set, the minimum is 2, the first quartile is 13, the median is 14, the third quartile is 15, and the maximum is 18. Construct a box-and-whisker plot that shows the number of lab pages.
Activity 6
Question
Based on the box-and-whisker plot from the solution above, what is the interquartile range of the data?
Activity 7
Question
The following frequency table summarizes a set of data. What is the five-number summary?
| Value | Frequency |
| 6 | 1 |
| 7 | 2 |
| 9 | 2 |
| 10 | 2 |
| 11 | 1 |
| 12 | 2 |
| 13 | 2 |
| 14 | 1 |
| 15 | 2 |
Activity 8
Question
The following frequency table summarizes a set of data. What is the five-number summary?
You may need to scroll down to view the entire table.
| Value | Frequency |
| 4 | 1 |
| 5 | 2 |
| 7 | 3 |
| 8 | 1 |
| 9 | 2 |
| 10 | 2 |
| 11 | 1 |
| 12 | 1 |
| 13 | 3 |
| 14 | 3 |
Activity 9
Question
The five number summary for a set of data is given below.
| Min | Q1 | Median | Q3 | Max |
| 67 | 68 | 80 | 81 | 86 |
What is the interquartile range of the set of data?
Activity 10
Question
The following frequency table summarizes a set of data. What is the five-number summary?
| Value | Frequency |
| 7 | 2 |
| 8 | 3 |
| 9 | 2 |
| 10 | 3 |
| 11 | 3 |
| 13 | 1 |
| 14 | 1 |
Activity 11
Question
The five number summary for a set of data is given below.
| Min | Q1 | Median | Q3 | Max |
| 54 | 56 | 80 | 86 | 87 |
Using the interquartile range, which of the following are outliers? Select all correct answers.
Activity 12
Question
A data set lists the number of extra credit points awarded on midterm scores of 15 students taking a statistics course. For this data set, the minimum is 3, the median is 15, the third quartile is 16, the interquartile range is 4, and the maximum is 19. Construct a box-and-whisker plot that shows the extra credit points awarded. Begin by first placing the middle dot on the median. Then work on placing the rest of the points starting with the ones closest to the median.
Week 3 Assignment: Lab
Prompt
Scenario/Summary
This week’s lab highlights the use of graphics, distributions, and tables to summarize and interpret data.
Deliverables
The deliverable is a Word document with your answers to the questions posed below based on the article you find.
Required Software
- Microsoft Word
- Internet access to read articles
Steps to Complete Week 3 Lab
Part 1:
Step 1: Your instructor will provide you with a scholarly article. The article will contain at least one graph and/or table. Summarize the article.
Part 2:
Title your paper: “Review of [Name of Article]”
State the Author:
Summarize the article in one paragraph:
Post a screen shot of a frequency table and/or graph from the article
Example:
Frequency Distribution OR Graph
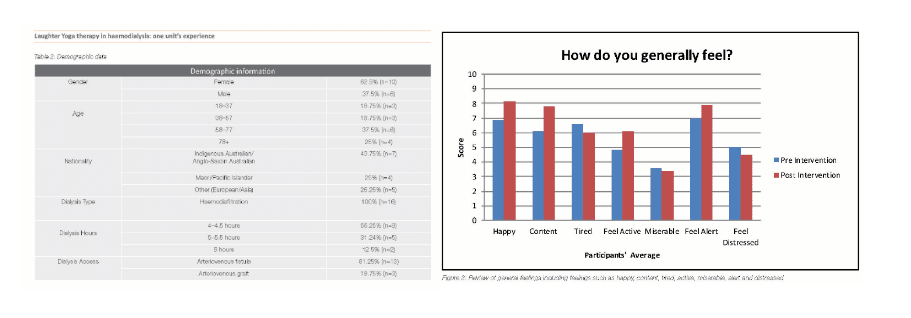
Step 4: Answer the following questions about your table or graph.
- What type of study is used in the article (quantitative or qualitative)? Explain how you came to that conclusion.
- What type of graph or table did you choose for your lab (bar graph, histogram, stem & leaf plot, etc.)? What characteristics make it this type (you should bring in material that you learned in the course)?
- Describe the data displayed in your frequency distribution or graph (consider class size, class width, total frequency, list of frequencies, class consistency, explanatory variables, response variables, shapes of distributions, etc.)
- Draw a conclusion about the data from the graph or frequency distribution in context of the article.
- How else might this data have been displayed? Discuss pros and cons of 2 other presentation options, such as tables or different graphical displays. Why don’t you think those two graphs were not used in this article?
- Give the full APA reference of the article you are using for this lab.
Step 5: Be sure your name is on the Word document, save it, and then submit it under “Assignments” and “Week 3: Lab”.

![[Solved] ENGL147N - Week 7 Assignment- Final Draft of the Argument Research Paper](https://prolifictutors.com/wp-content/uploads/2023/01/Solved-ENGL147N-Week-7-Assignment-Final-Draft-of-the-Argument-Research-Paper--240x142.png)
![[Solution] - NR305 - Week 3 Discussion: Debriefing of the Week 2 iHuman Wellness Assignment (Graded](https://prolifictutors.com/wp-content/uploads/2022/06/Best-Answer-NR305-Week-3-Discussion-Debriefing-of-the-Week-2-iHuman-Wellness-Assignment-Graded--240x142.png)

![[Best Answer] NR305 - Week 2 Discussion: Reflection on the Nurse’s Role in Health Assessment (Graded)](https://prolifictutors.com/wp-content/uploads/2022/06/Best-Answer-NR305-Week-2-Discussion-Reflection-on-the-Nurses-Role-in-Health-Assessment-Graded-240x142.png)
![[Best Answer] NR305 - Week 2 Assignment: Wellness Assessment: Luciana Gonzalez (iHuman) (Graded)](https://prolifictutors.com/wp-content/uploads/2022/06/Best-Answer-NR305-Week-2-Assignment-Wellness-Assessment-Luciana-Gonzalez-iHuman-Graded--240x142.png)

