[Solved] FD08 – International Finance – Portfolio Analysis via multiple investment signals on 120 firms in the pan-European index STOXX Europe 600 (STOXX) or US S&P 500 (SPX)
November 23, 2021 2021-11-23 10:15[Solved] FD08 – International Finance – Portfolio Analysis via multiple investment signals on 120 firms in the pan-European index STOXX Europe 600 (STOXX) or US S&P 500 (SPX)

[Solved] FD08 – International Finance – Portfolio Analysis via multiple investment signals on 120 firms in the pan-European index STOXX Europe 600 (STOXX) or US S&P 500 (SPX)
Course – FD08 [International Finance] under International Financial Markets
School – ESCP Europe Business School
Assignment instructions (I)
- Each group will be allocated to an investment signal and a stock index (STOXX Europe 600 or S&P 500).
- Elaborate theoretically on why and how your investment signal should affect stock prices. You are expected to rely on scientific studies for this research (make use of your course “Academic Writing Skills”).
- Conduct a portfolio analysis using your allocated investment signal.
- Limit the sample of your calculations to 120 firms drawn from the pan-European index STOXX Europe 600 (STOXX) or US S&P 500 (SPX), as indicated in the signal allocation. To that extent, the market is captured by the respective index.
- The sample of analysis should span at least a 10-year period.
- Remember that you need a 6-month time lag between the observation of the signals and the computation of the returns on your different portfolios.
- Use weekly data, as was the case in the in-class application for the size-based portfolios! For all your computations you would assume the riskless rate to equal the three-month EURIBOR [EURIBOR 3M], which will be provided to you.
- Out of the 120 firms, you are required to construct three portfolios using tertiles, and compute the buy-and-hold returns on each value-weighted and equally-weighed portfolio.
- Write a selling proposition for your portfolio thus constructed, that is, you should tell about why one should invest in your portfolios.
- Provide a matrix of the transition probabilities once you created the portfolios, and interpret the resulting figures.
- Present some descriptive statistics of your choice, which you will properly discuss!
- Provide a graphical value development of the three style portfolios!
- What is the abnormal return on each of the three portfolios?
- Use the CAPM as return-generating process to this end!
Overview of some of the investment signals (II)
12. Profit margin
13. Return on equity (actual)
14. Return on assets (actual)
15. Total return (momentum)
16. Cash and cash equivalents to total assets
17. Sales growth (1-year annual revenues growth)
18. Selling, general, and administrative expenses to total assets
19. International sales to total sales
20. International assets to total assets
21. International asset turnover
We have already solved this FD08 question. Get your custom READY solution by ordering here –https://prolifictutors.com/place-order/– or by reaching us via the chat window or email on our homepage.
Statistical outputs
| Equally Weighted Portfolio | Value Weighted Portfolio | |||||||
| Stats | P1 | P2 | P3 | Market Portfolio | P1 | P2 | P3 | Market Portfolio |
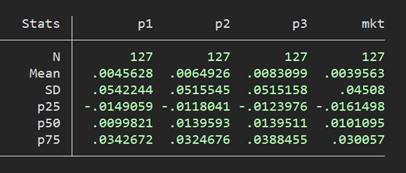
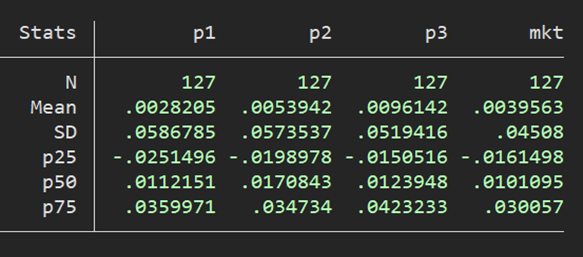
| # observations (N) | 127 | 127 | 127 | 127 | 127 | 127 | 127 | 127 |
| Average Excess Return | 0.46% | 0.65% | 0.83% | 0.40% | 0.28% | 0.54% | 0.96% | 0.40% |
| SD (Risk) | 5.42% | 5.16% | 5.15% | 4.51% | 5.87% | 5.74% | 5.19% | 4.51% |
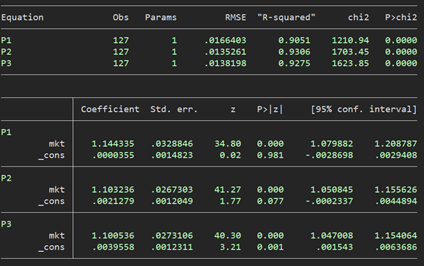
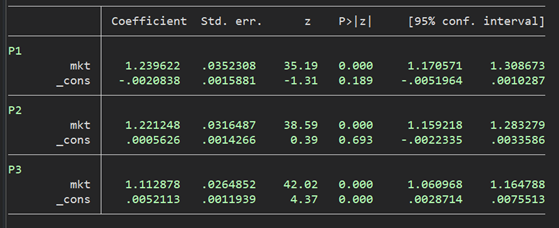
| Beta (CAPM) | 1.144 | 1.103 | 1.101 | 1.000 | 1.240 | 1.221 | 1.113 | 1 |
| Treynor Ratio | 0.40% | 0.59% | 0.76% | 0.40% | 0.23% | 0.44% | 0.86% | 0.40% |
| Sharpe Ratio | 8.41% | 12.59% | 16.13% | 8.78% | 4.81% | 9.41% | 18.51% | 8.78% |
| Jensen’s Alpha | 0.00% | 0.21% | 0.40% | 0.00% | -0.21% | 0.06% | 0.52% | 0.00% |
| Unsystematic Variance | 0.000 | 0.000 | 0.000 | 0.000 | 0.000 | 0.000 | 0.000 | 0.000 |
| Unsystematic Risk | 0.017 | 0.014 | 0.014 | 0.000 | 0.018 | 0.016 | 0.013 | 0.000 |
| Information Ratio | 0.002 | 0.157 | 0.285 | 0.000 | -0.116 | 0.035 | 0.387 | 0.000 |
![[Solved] ENGL147N - Week 7 Assignment- Final Draft of the Argument Research Paper](https://prolifictutors.com/wp-content/uploads/2023/01/Solved-ENGL147N-Week-7-Assignment-Final-Draft-of-the-Argument-Research-Paper--240x142.png)
![[Solution] - NR305 - Week 3 Discussion: Debriefing of the Week 2 iHuman Wellness Assignment (Graded](https://prolifictutors.com/wp-content/uploads/2022/06/Best-Answer-NR305-Week-3-Discussion-Debriefing-of-the-Week-2-iHuman-Wellness-Assignment-Graded--240x142.png)

![[Best Answer] NR305 - Week 2 Discussion: Reflection on the Nurse’s Role in Health Assessment (Graded)](https://prolifictutors.com/wp-content/uploads/2022/06/Best-Answer-NR305-Week-2-Discussion-Reflection-on-the-Nurses-Role-in-Health-Assessment-Graded-240x142.png)
![[Best Answer] NR305 - Week 2 Assignment: Wellness Assessment: Luciana Gonzalez (iHuman) (Graded)](https://prolifictutors.com/wp-content/uploads/2022/06/Best-Answer-NR305-Week-2-Assignment-Wellness-Assessment-Luciana-Gonzalez-iHuman-Graded--240x142.png)
