Description
Week 8: Regression
| Week | Assignments | Due Date |
| Week 8 | Graded Discussion | Suggested Due Date—
Initial Post: Wednesday of Week 8
Due Date— Responses: Sunday of Week 8 [Have two posts on two different days] |
| Knewton Homework Assignments
Coefficient of Determination Correlation and Causation Linear Regression Equations Performing Linear Regressions with Technology – Excel Predictions Using Linear Regression |
Sunday of Week 8 | |
| Week 8 final exam |
—————-
Week 8 Assignment – Performing Linear Regressions with Technology – Excel
Activity 1
Question
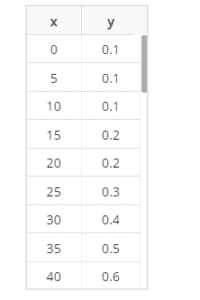
The table below shows primary school enrollment for a certain country. Here, x represents the number of years after 1820, and y represents the enrollment percentage. Use Excel to find the best fit linear regression equation. Round the slope and intercept to two decimal places.
Answer
Access the entire solutions for this week (top graded solutions) by clicking the ‘Buy’ button.
Activity 2
Question
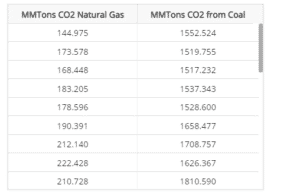
An energy economist studying the growth and decay of both the coal and natural gas industries wanted to leverage data collected by environmental scientists. Particularly, the economist wanted to study the link between the total yearly carbon emissions from both energy sources. They looked at 30 years of total yearly carbon emissions for a particular nation (measured in million metric tons of carbon dioxide) for both forms of energy. The data is provided below. Use Excel to calculate the correlation coefficient r between the two data sets. Round your answer to two decimal places.
Provide your answer below:
Answer
Access the entire solutions for this week (top graded solutions) by clicking the ‘Buy’ button.
Activity 3
Question
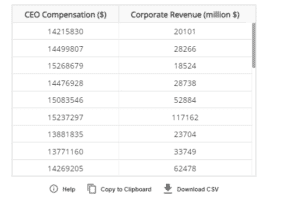
Jorge is an economist trying to understand whether there is a strong link between CEO compensation and corporate revenue. He gathered data including the CEO compensation for 30 randomly selected corporations for a particular year as well as the corporate revenue of those corporations for the same year. The data Jorge gathered are provided in the accompanying data table. Use Excel to calculate the correlation coefficient r between the two data sets. Round your answer to two decimal places.
Provide your answer below:
Answer
Access the entire solutions for this week (top graded solutions) by clicking the ‘Buy’ button.
Activity 4
Question
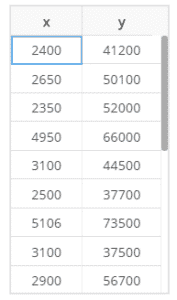
The table below shows data on annual expenditure, x (in dollars), on recreation and annual income, y (in dollars), of 20 families. Use Excel to find the best fit linear regression equation. Round the slope and intercept to the nearest integer.
Answer
Access the entire solutions for this week (top graded solutions) by clicking the ‘Buy’ button.
Activity 5
Question
An economist is studying the link between the total value of a country’s exports and that country’s gross domestic product, or GDP. The economist recorded the GDP and Export value (in millions of $’s) for 30 nations for the same fiscal year. This sample data is provided below.
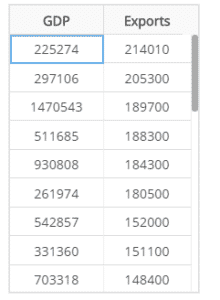
Use Excel to calculate the correlation coefficient r between the two data sets. Round your answer to two decimal places
Answer
Access the entire solutions for this week (top graded solutions) by clicking the ‘Buy’ button.
Activity 6
Question
An economist is trying to understand whether there is a strong link between CEO pay ratio and corporate revenue. The economist gathered data including the CEO pay ratio and corporate revenue for 30 companies for a particular year. The pay ratio data is reported by the companies and represents the ratio of CEO compensation to the median employee salary. The data are provided below. Use Excel to calculate the correlation coefficient r between the two data sets. Round your answer to two decimal places
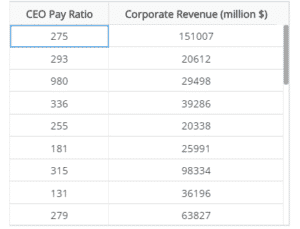
The correlation coefficient can be calculated with Excel using the built-in CORREL function.
- Open the accompanying data set in Excel.
- In an open cell, type “=CORREL(A2:A31,B2:B31)”, and then hit ENTER.
You could label the result of this cell by writing “Correlation coefficient” or “r” in an adjacent open cell.
Answer
Access the entire solutions for this week (top graded solutions) by clicking the ‘Buy’ button.
Activity 7
Question
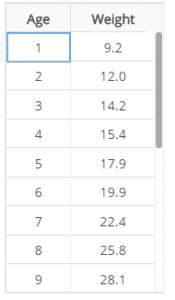
The table below gives the average weight (in kilograms) of certain people ages 1–20. Use Excel to find the best fit linear regression equation, where age is the explanatory variable. Round the slope and intercept to two decimal places.
Answer
Access the entire solutions for this week (top graded solutions) by clicking the ‘Buy’ button.
Activity 8
Question
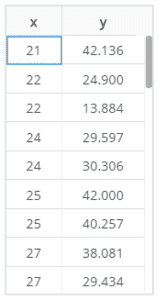
In the following table, the age (in years) of the respondents is given as the x value, and the earnings (in thousands of dollars) of the respondents are given as the y value. Use Excel to find the best fit linear regression equation in thousands of dollars. Round the slope and intercept to three decimal places.
Answer
Access the entire solutions for this week (top graded solutions) by clicking the ‘Buy’ button.
Activity 9
Question
The heights (in inches) and weights (in pounds) of 25 baseball players are given below. Use Excel to find the best fit linear regression equation, where height is the explanatory variable. Round the slope and intercept to two decimal places.
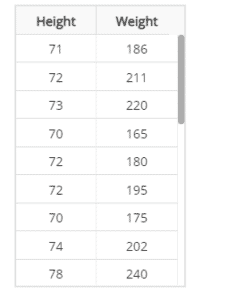
Answer
Access the entire solutions for this week (top graded solutions) by clicking the ‘Buy’ button.
Activity 10
Question
The heights (in inches) and weights (in pounds) of 25 baseball players are given below. Use Excel to find the best fit linear regression equation, where height is the explanatory variable. Round the slope and intercept to two decimal places.
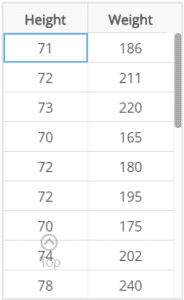
Answer
Access the entire solutions for this week (top graded solutions) by clicking the ‘Buy’ button.
Activity 11
Question
A market researcher looked at the quarterly sales revenue for a large e-commerce store and for a large brick-and-mortar retailer over the same period. The researcher recorded the revenue in millions of dollars for 30 quarters. The data are provided below. Use Excel to calculate the correlation coefficient r between the two data sets. Round your answer to two decimal places.
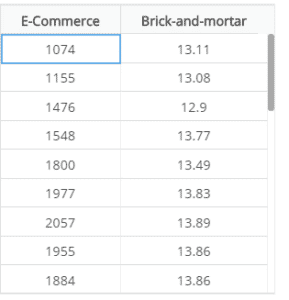
Answer
Access the entire solutions for this week (top graded solutions) by clicking the ‘Buy’ button.
Activity 12
Question
An amateur astronomer is researching statistical properties of known stars using a variety of databases. They collect the absolute magnitude or MV and stellar mass or M⊙ for 30 stars. The absolute magnitude of a star is the intensity of light that would be observed from the star at a distance of 10 parsecs from the star. This is measured in terms of a particular band of the light spectrum, indicated by the subscript letter, which in this case is V for the visual light spectrum. The scale is logarithmic and an MV that is 1 less than another comes from a star that is 10 times more luminous than the other. The stellar mass of a star is how many times the sun’s mass it has. The data is provided below. Use Excel to calculate the correlation coefficient r between the two data sets, rounding to two decimal places.
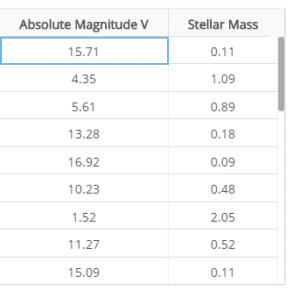
Answer
Access the entire solutions for this week (top graded solutions) by clicking the ‘Buy’ button.

![[Top Answer] MATH225N - Week 8 Assignment Performing Linear Regressions with Technology – Excel](https://prolifictutors.com/wp-content/uploads/2022/07/Top-Answer-MATH225N-Week-8-Assignment-Performing-Linear-Regressions-with-Technology-–-Excel.jpg)
![[Top Answer] MATH225N - Week 1 Assignment - Comparing Sampling Methods - MATH225N Statistical Reasoning for the Health Sciences](https://prolifictutors.com/wp-content/uploads/2022/07/Top-Answer-MATH225N-Week-1-Assignment-Comparing-Sampling-Methods-MATH225N-Statistical-Reasoning-for-the-Health-Sciences.jpg)

![[Solution] - NR305 - Week 6 Discussion: Reflection on Nursing Assessment for Violence (Graded)](https://prolifictutors.com/wp-content/uploads/2022/06/Solution-NR305-Week-6-Discussion-Reflection-on-Nursing-Assessment-for-Violence-Graded.png)
![[Top Answer] MATH225N - Week 1 Assignment - Evidence, Claims and Study Types - MATH225N Statistical Reasoning for the Health Sciences](https://prolifictutors.com/wp-content/uploads/2022/07/Top-Answer-MATH225N-Week-1-Assignment-Evidence-Claims-and-Study-Types-MATH225N-Statistical-Reasoning-for-the-Health-Sciences.jpg)


Reviews
There are no reviews yet.