![[Top Answer] MATH225N - Week 3 Assignment - Distribution Shape - MATH225N Statistical Reasoning for the Health Sciences](https://prolifictutors.com/wp-content/uploads/2022/07/Top-Answer-MATH225N-Week-3-Assignment-Distribution-Shape-MATH225N-Statistical-Reasoning-for-the-Health-Sciences.jpg)
Description
Week 3 Assignment: Distribution Shape
| Week | Assignments | Due Date |
| Week 3 | Graded Discussion | Suggested Due Date—
Initial Post: Wednesday of Week 3
Due Date— Responses: Sunday of Week 3 [Have two posts on two different days] |
| Knewton Homework Assignments
Measures of Central Tendency (Section 2.3) Understanding Measures of Central Tendency (Section 2.3 & 2.4) Distribution Shape (Section 2.6) Standard Deviation (Section 2.7) Quartiles and Box Plots (Section 2.2) |
Sunday of Week 3 | |
| Lab #1—Displaying Data | Sunday of Week 3 |
Objectives
3.3 Distribution Shape
Completed
- Determine if a data set is skewed
Activity 1
Question
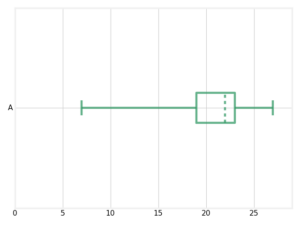
Given the following box-and-whisker plot, decide if the data is skewed or symmetrical.
Activity 2
Question
Given the following box-and-whisker plot, decide if the data is skewed or symmetrical.

Activity 3
Question
Which of the following frequency tables show a skewed data set? Select all answers that apply
Activity 4
Question
Which of the following histograms shows a skewed data set?


Reviews
There are no reviews yet.