![[Top Answer] MATH225N - Week 2 Assignment - Frequency Tables and Histograms - MATH225N Statistical Reasoning for the Health Sciences](https://prolifictutors.com/wp-content/uploads/2022/07/Top-Answer-MATH225N-Week-2-Assignment-Frequency-Tables-and-Histograms-MATH225N-Statistical-Reasoning-for-the-Health-Sciences.jpg)
Description
Week 2 Assignment: Frequency Tables and Histograms
| Week | Assignments | Due Date |
| Week 2 | Graded Discussion | Due Date—
Responses: Sunday of Week 2 [Have two posts on two different days] |
| Knewton Homework Assignments
Frequency Tables (Section 2.1) Frequency Tables & Histograms (Section 2.1) Stem & Leaf (Section 2.1) Line & Bar Graphs (Section 2.1) |
Sunday of Week 2 | |
| Knewton Quiz #1
· Covers Week 1 – 2 Material · 25 Questions · 2 Attempts |
Sunday of Week 2 |
Objectives
2.2 Frequency Tables and Histograms
- Create and interpret histograms
- Identify and label shapes of histograms
Activity 1
Question
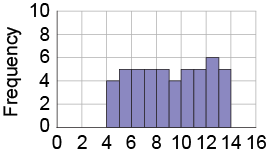
Given the following frequency distribution table for a set of data about the time spent writing an email (in minutes) for all employees at a small company, construct a histogram that accurately summarizes the data.
| Writing an Email (in minutes) | Frequency |
| 6.5-8.5 | 1 |
| 8.5-10.5 | 3 |
| 10.5-12.5 | 4 |
| 12.5-14.5 | 6 |
| 14.5-16.5 | 5 |
| 16.5-18.5 | 7 |
Create the corresponding histogram to represent this data below. Drag the dots on the top of the histogram to create the chart.
Activity 2
Question
According to the histogram, which range of minutes contains the highest frequency for time spent writing an email?
Activity 3
Question
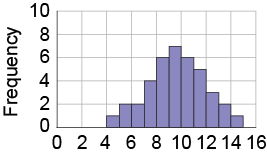
Describe the shape of the given histogram.
Activity 4
Question
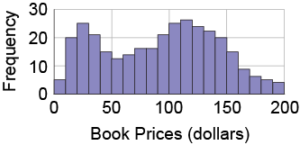
A bookstore took an inventory of the prices of its books and created a histogram to show the results. What shape does the distribution have?
Activity 5
Question
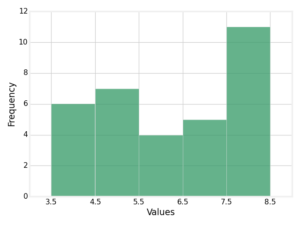
Several people were asked to report the number of hours of sleep they average per night. The results are shown in the histogram below. How many of those people average greater than 4.5 and less than 6.5 hours of sleep per night?
Activity 6
Question
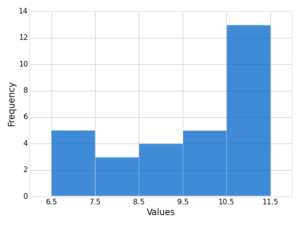
The speed (in mph) of randomly selected bicyclists were measured as they were approaching a hill. The results are presented in the following histogram.
How many of those bicyclists were traveling at least 8.5 and less than 11.5 mph as they were approaching the hill?
Activity 7
Question
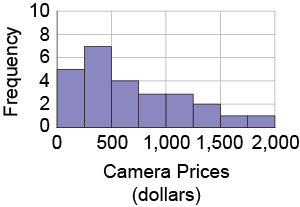
The histogram below represents the prices of digital SLR camera models at a store. Describe the shape of the distribution.
Activity 8
Question
Describe the shape of the given histogram.

![[Solution] - CSTU 220 - Assess how the Great Migration shaped African American churches, as millions of African Americans moved North and West out of the South, and how, in turn, these church communities influenced the culture and politics of bourgeoning urban communities](https://prolifictutors.com/wp-content/uploads/2022/05/Solution-CSTU-220-Assess-how-the-Great-Migration-shaped-African-American-churches.png.webp)
![[Solved] NR451 - Week 2 Check-In - Communication and Influence - the Power of Evidence (graded)](https://prolifictutors.com/wp-content/uploads/2023/03/Solved-NR451-Week-2-Check-In-Communication-and-Influence-the-Power-of-Evidence-graded-.png.webp)


Reviews
There are no reviews yet.