Bivariate Statistics (CCJ4700 – Intro to research methods in criminology)
June 11, 2021 2021-06-11 14:39Bivariate Statistics (CCJ4700 – Intro to research methods in criminology)

Bivariate Statistics
CCJ4700 – Intro to research methods in criminology
Bivariate analysis is done with the intention of examining the relationship between two variables. Using a bivariate analysis, it is possible to find out test the hypothesis of association between a dependent variable and an independent variable – correlation. This measure includes the test of how the value of one variable can be predicted if the value of the other variable is known. Further the analysis can show the direction of correlation – positive or negative Pearson correlation. Beyond examining the relationship between two single variables, bivariate analysis also enables measuring relationships between two groups of variables (categorical or dummy variables) using cross-tabulation. Bivariate analysis also includes a test of significant to establish the extent to which a correlation could be by chance.
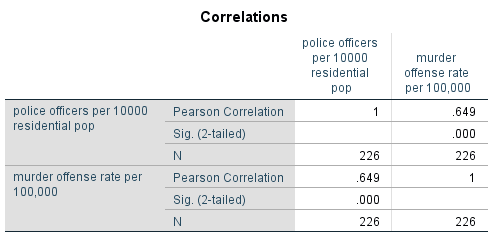
A correlation was done between Police officers per 10,000 people and Murder offense rate per 100,000 people. A correlation value (r) of 0.649 was found as in Table 1 below. The correlation was positive. The p-value was 0.000 also as in Table 1 below. Given the p-value (0.000) is less than Alpha (0.05), the correlation is significant. This correlation means that the higher the number of Police officers per 10,000 people, the more likely the Murder offense rate per 100,000 people can be found in the same set of population. This may imply that police officers are more concentrated in areas with comparatively higher murder rates.
Need a paper like this one? Order here – https://prolifictutors.com/place-order/
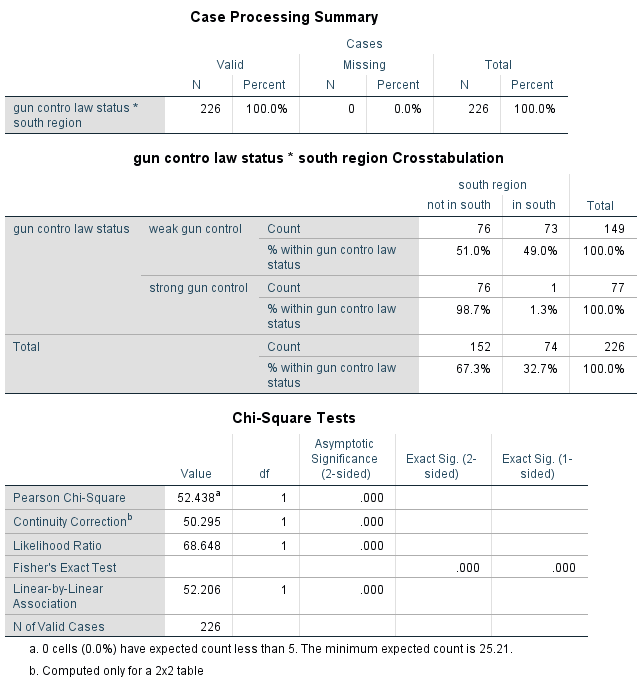
A crosstab was done between Gun control law status and Southern region city status. The chi-square value was found to be 52.438 as in Table 2 below. The degree of freedom was 1. The p-value was 0.000 as in Table 2. The crosstab is significant since the p-value (0.000) is less than the Alpha value (0.05). The crosstab findings can be interpreted to mean that there is a relationship between Gun control status and cities in the Southern region.
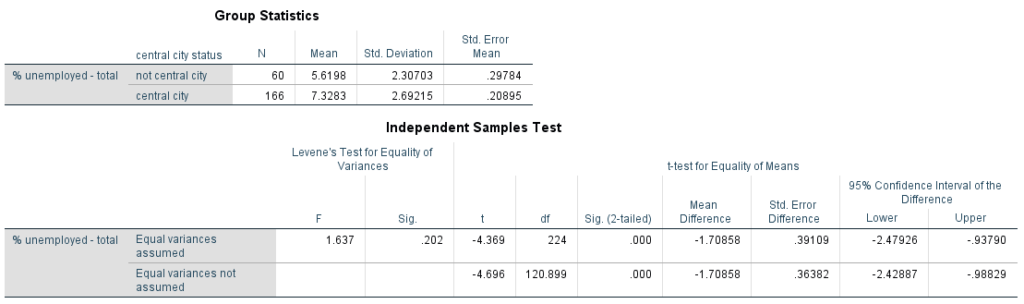
A t-test was done between % of Unemployment in the population (ratio variable) and Central status of the city (dummy variable). The central status of the city was either (i) not central city or (ii) central city. The mean % of Unemployment in the population in Not central cities was 5.6198 while that of Central city was 7.3283 as in Table 3 below. The difference between means was -1.7085. The t-statistic was -4.369. The p-value was 0.000. This means that % of Unemployment is significantly related to Central status of a city. The interpretation is that cities with a Not central status tend to have a higher % of Unemployment while those with a status of Central status have a lower % of Unemployment.
Table 1: Correlation between Police officers per 10,000 people and Murder offense rate per 100,000
| Variables | Correlation co-efficient | p-value |
| Police officers per 10,000 and Murder offense rates per 100,000 | 0.649 | 0.000 |
Table 2: Chi-square test for Crosstab between Gun control law status and Southern region city status
| Variables | Chi-square | DF | p-value |
| Gun control law status and Southern region city status | 52.438 | 1 | 0.000 |
Table 3: T-test for Difference of Means of % of unemployment between central status cities and non-central status cities
| Not central city (0) | Central city (1) | Difference | t-statistic | p-value | |
| Mean % unemployment of total population | 5.6198 | 7.3283 | -1.7085 | -4.369 | 0.000 |
SPSS Syntax
corr vars = poloff omurder.
crosstabs/tables = gunlaws by south / statistics = chisq / cells = count row.
t-test groups = cntrcity (0,1) / vars = unemploy.
SPSS Output
Two ratio variables
Two dummy variables
One ratio and one dummy variable
Need a paper like this one? Order here – https://prolifictutors.com/place-order/
![[Solved] ENGL147N - Week 7 Assignment- Final Draft of the Argument Research Paper](https://prolifictutors.com/wp-content/uploads/2023/01/Solved-ENGL147N-Week-7-Assignment-Final-Draft-of-the-Argument-Research-Paper--240x142.png)
![[Solution] - NR305 - Week 3 Discussion: Debriefing of the Week 2 iHuman Wellness Assignment (Graded](https://prolifictutors.com/wp-content/uploads/2022/06/Best-Answer-NR305-Week-3-Discussion-Debriefing-of-the-Week-2-iHuman-Wellness-Assignment-Graded--240x142.png)

![[Best Answer] NR305 - Week 2 Discussion: Reflection on the Nurse’s Role in Health Assessment (Graded)](https://prolifictutors.com/wp-content/uploads/2022/06/Best-Answer-NR305-Week-2-Discussion-Reflection-on-the-Nurses-Role-in-Health-Assessment-Graded-240x142.png)
![[Best Answer] NR305 - Week 2 Assignment: Wellness Assessment: Luciana Gonzalez (iHuman) (Graded)](https://prolifictutors.com/wp-content/uploads/2022/06/Best-Answer-NR305-Week-2-Assignment-Wellness-Assessment-Luciana-Gonzalez-iHuman-Graded--240x142.png)
