Analysing factors that influence customer brand loyalty in the UK mobile telecommunication industry – A case study of O2
January 17, 2022 2022-01-17 16:39Analysing factors that influence customer brand loyalty in the UK mobile telecommunication industry – A case study of O2

Analysing factors that influence customer brand loyalty in the UK mobile telecommunication industry – A case study of O2
Need a paper like this one? Get in touch via the email address or order form on our homepage.
Get Chapters 1 to 3 HERE.
Chapter four: Data Findings and Analysis
4.1. Introduction
Following the provisions of the methodology section, this chapter aims at analysing the primary data that was obtained through the use of questionnaires. The analysis is carried out in accordance to the research aim and objectives. The chapter commences with an analysis of the demographic profile of the respondents, that is, age, sex, gender, marital status and education level. The chapter also analyses brand loyalty perspective and the factors that affect brand loyalty. Lastly, the section analyses the factors that limit customer brand loyalty and ends with a summary of the aforementioned factors. The findings are also analysed in light of the extant literature as contained in the literature review.
4.2. Profile of the respondents
Respondent characteristics and more specifically respondent demographic profiles are evidenced to have an impact on customer purchase behaviour and more so on customer brand loyalty (Diamantopoulos et al., 2012). In addition demographic characteristics are important on the premise that they are used by marketers in designing promotional campaigns among other uses. In this study all the respondents were residents of England from the Newcastle region.
(i) An analysis of respondents’ sex

Figure 1: Respondents’ sex
As depicted in figure 1 above, the female respondents constituted 52% of the total respondents while the male respondents made up the remaining 48%. Despite this discrepancy in representation, the distribution of males and females is proportional and thus still offers a valid ground for the conduct of a representative study. Additionally, these findings are consistent with the propositions of a census on England in 2011 that notes females have outnumbered males in the UK in the recent years (ONS, 2011).
(ii) An analysis of respondents’ age
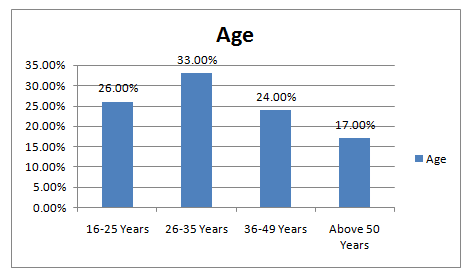
Figure 2: Respondents’ age distribution
From the bar chart above (figure 2) it can be seen that a majority of the respondents belong to the age bracket of 26- 35 years. This category constitutes 33% of the entire population. The next biggest bracket is the 16-25 years bracket which constitutes 26% of the entire population. Evidently, the population is made up of young people as the majority. The government’s website on Newcastle shows that the population of young people is the highest (Newcastle, 2015). This is congruent to the findings of this study. The gap between the majority among the respondents and minority in the respondents is 16 %. However, the rest of the age brackets are almost at par and since the percentage of the old respondents can be attributed to their low composition in the study area, the age proportions were considered valid for this study.
(iii) An analysis of respondents’ educational level

Figure 3: Respondents’ educational level
The bar chart above (figure 3) summarises the percentage representation of the highest educational level of the respondents. A majority of the respondents had a college diploma (32%). Those with high school diplomas and undergraduate degrees followed closely with 27% and 25% respectively. Essentially, this distribution can be attributed to the area of study which is an urban environment consisting of several tertiary institutions and the researcher focused more on them. Few respondents were below the high school level (7%) and few above the undergraduate level (9%). This distribution was deemed valid for the study because one of the keen interests of the researcher was to avoid language barriers and to ensure the respondents understood the questionnaire.
(iv) An analysis of respondents’ length of stay with O2.
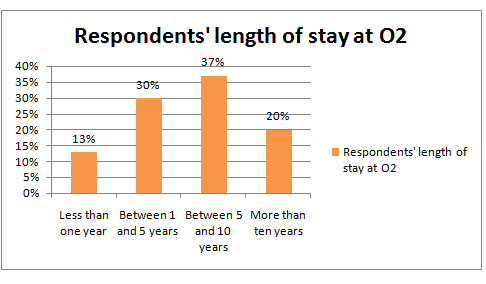
Figure 4: Respondent’s length of stay at O2
The above bar chart analyses the length of stay of the respondents at O2. As such, the biggest percentage of the respondents (37%) had spent between 5 to 10 years at O2. The next biggest percentage is of those that have had spent between 1 to 5 years (30%). Those who had stayed more than ten years were 20% while those that had stayed for less than one year were 13%. Attributing to the fact that a majority of the respondents had spent between 1 and 10 years at O2 then the distribution was deemed proper for the study.
4.3. An analysis of respondents’ brand loyalty perspectives
(i) An analysis of respondents’ loyalty to O2
Under the warm-up section of the questionnaire, the researcher had the intent of establishing the perspectives that customer held about loyalty. In general the majority of customers had stayed at O2 for considerably a long time (between 5 and 10 years) and would be considered brand loyal. The following figure 5 summarises customer perceptions about themselves in regard to being loyal. As apparent on the question as to whether a customer considers himself as loyal, 73% identified themselves as loyal. Contrasting this to extant literature, Nguyen (2013) posits that firms define customer loyalty through churning, a method that is consistent with how customers in this study identified themselves as loyal. Nguyen (2013) identifies that 90% of telecom companies use this method to establish customer loyalty.
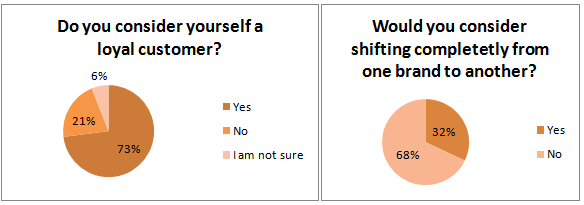
Figure 5: Respondent perception on loyalty.
In addition, the analysis of whether a respondent would consider shifting from one brand to another entirely shows that a majority (68%) would not consider shifting entirely from a brand to another. This means that even though the customers may not be entirely committed to a single brand (O2), they have loyalty tendencies to at least a single brand. To further strengthen the findings, Uncles et al (2003) also notes that churning is not the only method of establishing customer loyalty as other factors such as satisfaction come into play. Dissatisfaction majorly leads to shifting and thusly if a majority of customers are not shifting, it can be taken to mean they are satisfied.
(ii) An analysis of respondents’ expectation from loyalty programs
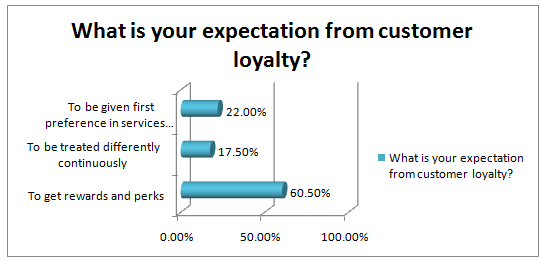
Figure 6: The expectations that respondents have on brand loyalty
As the figure above shows (figure 7), the majority of the respondents expected to be offered rewards and perks every once in awhile. This included 60.5% of the total respondents. The number of respondents who expected to be given special treatment although and those that expected to be given first priority in services lagged far behind at 17.5% and 22% respectively. Such a huge variation means that the rational preference for occasional rewards and perks is high. The main goal for firms in line with customer loyalty programs is achievable and sustainable programs. Uncles et al (2003) note firms endeavor to offer customers with loyalty programs that are efficient to the firm. In this study, the expectation seen from the customers end is congruent with this. Majorly, the expectation are rewards and perks which Uncles et al (2003) list as bonuses, points, upgrades and free services. Thusly, it is imperative to note that the effective loyalty program needs to be inclusive of perks and rewards.
(iii) An analysis of competitor services
The researcher designed the following two questions to establish the extent to which O2 customers reach out to the services of competitors available within the Newcastle region. (a) Do you use the services of other telecommunication providers? (b) If yes, from which other provider do you get services from? The main choices for competitors were EE and Vodafone.
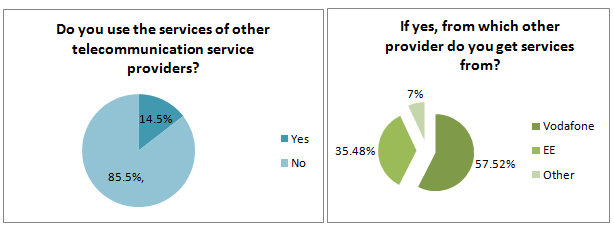
Figure 7: Respondents subscription to competitors’ services
The findings from the analysis above indicate that a big number of the respondents do not subscribe to other services besides those offered by O2. This group forms 85.5% of the total respondents. On the other hand 14.5% of the respondents use the services of other providers (competitors). Further, as figure 7 above indicates, the major competitors for O2, evidenced by the percentage of respondents that use them, are EE and Vodafone. Thusly, of the 14.5% of O2 customers that are not entirely loyal, 57.52% are loyal to Vodafone and 35.48% are loyal to EE. The analysis means that O2 shared almost a quarter of its customers with majorly Vodafone and also with EE.
Extant literature on the nature the UK telecom market reveals a competition-driven market with many players in the market but EE, Vodafone and O2 remaining the biggest competitors. Choi and Click (2006) and Pedley (2013) note competition is characterised by these domestic firms and inevitably the nature of competition has impact on levels on customer loyalty in the UK. O2, noting form the study that over 80% of customers use its services, has competed relatively well.
4.4. An analysis of factors influencing brand loyalty
4.4.1. Price
| N | Minimum | Maximum | Mean | Std. Deviation | |
| O2 charges fair prices in regard to the quality of services they offer | 126 | 1.00 | 5.00 | 2.1032 | 1.10872 |
| It is okay for O2 to charge higher prices than competitors | 126 | 1.00 | 5.00 | 3.7302 | 1.18937 |
| O2 charge fair prices across all its services | 126 | 1.00 | 5.00 | 2.6111 | 1.13822 |
| I have no issue with O2 prices | 126 | 1.00 | 5.00 | 3.5556 | 1.23648 |
| Valid N (list wise) | 126 |
Table 1: The descriptive statistics analysis of price and how it influences customer loyalty
Price is always a determining factor as to which product or service customers will subscribe to (Srivastava and Sharma, 2013). There are issues that were identified in extant literature from Schultz (2014) that influence customers’ loyalty one of them being low prices. Analyses of the questions regarding the influence of price on brand loyalty are depicted in table 1. As evident, there are three aspects that are taken to represent the influence of price on brand loyalty including price-quality relationship, comparability of price to competitors and standard prices across services.
(i) O2 prices versus the quality of services
As depicted in the literature review section, prices matter when it comes to brand loyalty. In addition, on a specific perspective, price formation, pricing systems and additional fees on prices are the factors that affect brand loyalty (Dong & Won, 2007). These elements are discussed belong alongside study findings. Firstly, an important aspect to prices is the price formation strategy which directly relates to the study’s quality versus price concept. (Jiang, Chou and Tao, 2011) posits that besides regulations by the government, operational costs also impact on price formation. A good price takes into account the compensatory effect on the inputs used – which determines the quality of the output. Thusly, it can be inferred that unreasonable pricing, that is, pricing that is not justified by the quality of services offered, is not popular with the customers.
Table 1 above depicts that customers of O2 find the quality of services and the prices charged are congruent. The mean for the response to the question appears as 2.1 which is more towards the strongly agree than to the strongly disagree. Therefore as inferred from the review of literature, the price-quality match matters in regard to brand loyalty. In addition, as shown in table 2 below, a majority of the respondents responded with “agree” showing they are concerned with the quality as much as price is an issue.
| O2 charges fair prices in regard to the quality of services they offer | |||||
| Frequency | Percent | Valid Percent | Cumulative Percent | ||
| Valid | Strongly agree | 42 | 32.6 | 33.3 | 33.3 |
| Agree | 52 | 40.3 | 41.3 | 74.6 | |
| Neutral | 15 | 11.6 | 11.9 | 86.5 | |
| disagree | 11 | 8.5 | 8.7 | 95.2 | |
| strongly disagree | 6 | 4.7 | 4.8 | 100.0 | |
| Total | 126 | 100.0 | 100.0 | ||
Table 2: An analysis of the price-quality relationship
(ii) An analysis of O2 prices versus those of competitors
Schultz (2014) notes a firm’s pricing plan relative to that of competitors has an effect of the particular brand. This means that customers will always compare prices across the board to determine which prices are fair and justifiable. As, Griffin (2013) elaborates, it is paramount for companies to flex their prices relative to those of competitors because this is always a consideration on the end of customers. Therefore, the optimal pricing strategy according to Griffin (2013) should be the competitor-based pricing system. However, an exception to this emerges as a situation where the quality of services drives customers to overlook price differences. The research question regarding this was an inquiry as to whether it was okay for O2 to charge prices higher than competitors. A descriptive analysis of the response in table 1 above shows that the responses leaned more towards the strongly agree choice. The mean for the responses was 3.7. Additionally, further analysis of frequency reveals that ‘strongly disagree’ appeared most times (42 times). As such, it is conclusive to point out from the findings that the respondents are concerned about prices of O2 in relation to those of competitors. This is in agreement to extant literature.
(iii) An analysis of O2 prices across its services
The researcher intended to establish whether O2 had price discrimination across its services. The mean to the responses was 2.6 with a standard deviation of 1.1. The standard deviation shows that most of the responses converged around the mean. Therefore, it can be conclusive to say that customers believe O2 charges fair prices across is services. As such, price fairness relates to price discrimination in the sense that prices are tailored to capture different customers during peak and off-peak hours. Ramirez (2007) evidences that fair prices across price discrimination segments serves to boost customer brand loyalty and brand preference. A crucial underlying point is that customers’ perception of the fairness of prices across services – call-tariffs, SMS tariffs and data tariffs – influences their loyalty to a particular brand – in this case O2.
(iv) Customers not concerned with prices
Asked as to whether they had no issue with O2 prices, 40 respondents chose ‘strongly disagree’. However, on the same question, 32 respondents chose ‘agree’. Conclusively it means more respondents had issues with prices than those who did not. Previous research as portrayed in the literature review shows that customers are generally concern about the prices they pay and often compare prices across providers (Schultz, 2014; Srivastava and Sharma, 2013).
4.4.2. Brand Value
Perceived brand value is a factor that influences customers’ brand loyalty (Economist, 2013). In general, customers ascribe to brands that they perceive as having positive brand value. Additionally, the perceived worthiness of a firm adds a cap to brand switching costs attributing to the fact that customers enjoy low switching costs when shifting from brands with low value (Wieseke, Alavi and Habel, 2014).
| I like the brand image of O2 and I am satisfied being with them more than other brands | I believe O2 has stronger brands than EE and Vodafone | I see EE and Vodafone as inferior brands because my friends say so | The brand has provided premium service | ||
| N | Valid | 126 | 126 | 126 | 126 |
| Mean | 2.7063 | 3.0635 | 3.2143 | 2.6984 | |
| Std. Deviation | 1.16665 | 1.18488 | 1.09987 | .98200 |
Table 3: An analysis of brand value as a factor in brand loyalty
(i) Likability of a brand
The findings on whether a customer liked the brand image of O2 compared to other indicate a mean of 2.7 and a standard deviation of 1.1. This means that more respondents liked the brand in comparison to those that did not like the brand. The reason behind this may be explained by Keller’s brand equity model which expounds that customers’ perception can be tailored by an effort of the firm to bring out its positive attributes (Keller, 2013). Cho et al. (2014) believes that repeat purchase and recommendations to friends come from sensory and cognitive attraction of a customer to a brand and this can only be attained by tailoring products that meet the expectations of the customer. Similarly, this can be taken to explain the case of customer loyalty at O2.
(ii) Strength of O2’s brand against competitors.
However, an analysis of the frequencies and their percentages using descriptive statistics reveals that ‘agree’ was picked the most times – 44 times – representing 34.1 % of the respondents. Thusly, from the descriptive statistics it can be pointed out that most respondents view O2 as a stronger brand. Wang, Wei & Yu (2008) in their study argue that firms need to be keen in their bid to drive sales. The focus should not only lie in the sales volume but in aspects like customer satisfaction, product knowledge, relevance and preferences because they are fundamental in customers’ perception of brand value. In addition, the strength of a brand is measured by customers according to market share of the firm and relative price (Vazifehdoost, 2014). As such, it can be conclusive to point out that the strength of a brand influences the choice of a brand.
(iii) Brand perspectives of competing brands
The literature review on word of mouth and its impact on brand loyalty reveal that word of mouth propagates identity and perception of a brand easily (Kazemi et al., 2013). In the contemporary context, online platforms are used by customers to market brands they are loyal to Webber (2011). This means that peers have an impact when it comes to brand loyalty. However as to whether this is effective, the findings of this study indicate contrary; that most of the customers tend to disagree that they see other brands as inferior because their friends say so. As evidenced in table 3 above, the mean of the responses is 3.2.
(iv) Services offered by the current brand
Akhter (2009) believes that charging higher prices for premium services could be the futuristic way of differentiation. Pascoe (2014) also agrees that charging premium prices for premium products is a workable strategy. In relation to this, the findings of the study show that respondents perceived the services of O2 as premium. As evidenced in table 3, the mean for the responses was 2.6. This means that the level of services determines whether customers consider a brand as strong as not. An attribution to this is also because the analysis of whether respondents considered O2 as strong brand indicated affirmative.
4.4.3. Brand switching costs
The literature review categorises brand switching costs into three categories including transactional costs, learning costs and contractual costs noting that all three are experienced with time (Burnham, Frels and Mahajan, 2003).
| N | Minimum | Maximum | Mean | Std. Deviation | |
| I cannot switch brands because I will find it hard to get acquainted to a new service provider | 126 | 1.00 | 4.00 | 2.3333 | .91214 |
| I am not willing to give up the level of comfort and acquired knowledge in my current service provider | 126 | 1.00 | 5.00 | 2.4444 | .90823 |
| My provider offers rewards and bonuses that I am not ready to lose while switching | 126 | 1.00 | 5.00 | 2.5159 | .97762 |
| I can always switch brands regardless of incentives currently offered | 126 | 1.00 | 5.00 | 3.7460 | .90276 |
| Valid N (list wise) | 126 | ||||
Table 4: A comprehensive analysis of factors in brand switching costs in regard to brand loyalty
(i) Difficulty in establishing a relationship with a new service provider
The findings indicate, as evidenced by the 2.3 mean in table 4 above, that most of the respondents fear leaving O2 because they will find it hard to get acquainted to a new provider. This can be related to the learning cots elaborated in the literature review. Learning costs are part of switching costs resulting from a customer coming up to speed with a new service provider’s product orientation (Zolnierek, 2008). The study findings and the findings of previous researches are congruent on this issue.
(ii) Rewards, incentives and Bonuses
In the literature review are discussions of transactional and contractual costs. Transactional costs being those costs incurred in transition from an old provider to a new provider (Shi et al., 2011). Contractual costs are those incurred by a firm in a bid to retain customers through rewards and bonuses (Qayyum & Khang, 2011). Essentially, both these costs affect customers and firms differently. Customers will not switch between brands if the costs are enormous. This sentiment is supported by the findings which indicate that more respondents would not leave O2 because of the rewards and bonuses that they were offered occasionally. The mean for the particular question was 2.5 is affirmative. Hiking the costs of switching, for example using rewards and benefits, as in the case of O2 is seen by Lees et al. (2007) as an effective competition strategy and harness to consumer loyalty. The question analysing the incentives against the freewill of switching brands reveals that customers are considerate of incentives before switching from one brand to another. The means for this question was 3.7. Conclusively, the findings mean that rewards, incentives and bonuses are factors of consideration among the customers in regard to brand switching costs.
4.4.4. Loyalty level to the current brand
On the questions about perceived loyalty to O2, most of the responses indicated that the respondents were loyal to O2. This is as evidenced by table 5 below.
| I’m not considering shifting service providers entirely | I determine subscribe to more services at O2 if it is needed | I would recommend the services of O2 to a friend as opposed to those of EE and Vodafone | ||
| N | Valid | 126 | 126 | 126 |
| Mean | 3.1349 | 2.5635 | 2.5635 | |
| Std. Deviation | 1.00680 | .94230 | 1.06204 |
Table 5: Customer loyalty to O2
Firstly, the analysis as to whether the respondents were considering a shift to other brands gave a mean of 3.1. The scale of 3 being ‘neutral’, it can be taken to infer that most respondents would not consider shifting entirely to a new service platform. This can be attributed to the cases above that affect brand switching including the level of comfort in the current provider and the fear of establishing oneself with a new service provider. In regard to the question as to whether a respondent would consider subscribing to more services at O2, the findings indicate the mean at 2.5 which is affirmative. As such, it can be extrapolated that most of the respondents would consider subscribing to more services as are offered by O2. Lastly, as to whether a respondent would consider recommending the services of O2 to another person, the responses also were to the affirmative with a mean of 2.5. This means that the level of satisfaction and loyalty would cause the respondent to consider having a friend experience the same services. In addition, since the question was in comparison to EE and Vodafone, then it can be conclusive to point out that the respondents preferred the services of O2 as opposed to those of EE and Vodafone.
4.5. Factors that limit consumer brand loyalty
| N | Minimum | Maximum | Mean | Std. Deviation | |
| I would change brands if my friends convince me a particular brand is bad | 126 | 1.00 | 5.00 | 2.9841 | 1.17292 |
| I would not associate with a brand that has a tainted brand image | 126 | 1.00 | 5.00 | 3.2063 | .86086 |
| I would not be loyal to a brand that charges prices I deem unreasonable | 126 | 1.00 | 3.00 | 1.7778 | .54975 |
| Valid N (list wise) | 126 |
Table 6: Factors limiting consumer brand loyalty
(i) Peer Influence
The findings indicate a mean of 2.9 on the question as to whether a respondent would be influenced to change brands by their friend. Further analysis on this question revealed that the biggest percentage of the respondents – 27 % selected ‘agree’ as the answer which shows a considerable portion would use an advice from people around them to select brands. The same sentiments are evidenced in previous researches as Webber (2011) claims that online platforms enable customers to market their preferred brands to their friends and peers. Evidently, the choice and perception of a brand is influenced by peers through word of mouth. However, word of mouth can also be a limiting factor if customers have the wrong perception of a brand (Ganesh et al., 2009).
(ii) Brand Image
In general, the results infer a neutrality of responses as to whether a respondent would associate with a tainted brand image. This is evidenced by the mean of 3.2. However, previous research in literature review indicated customers will generally not associate with brands sporting tainted images. They gauge worthiness and value of a brand before ascribing to it (Wieseke, Alavi and Habel, 2014).
(iii) Unfair prices
Unreasonable prices emerged as a strong reason as to customer shifting from one brand to another. According to the findings, the mean of the relevant question was 1.7 which suggests that most of the answers were to the affirmative. As such, the findings mean that customers cannot stay loyal to a brand that is charging unjustifiable prices. Table 7 below shows an analysis of the responses in regard of the same. The same findings are prevalent in the literature review where Srivastava and Sharma (2013) note that prices are relevant when customers are weighing on which brand to choose. Schultz (2014) adds to this by pointing out that low prices are essentially the most important aspect to customers.
| I would not be loyal to a brand that charges prices I deem unreasonable | |||||
| Frequency | Percent | Valid Percent | Cumulative Percent | ||
| Valid | Strongly agree | 36 | 27.9 | 28.6 | 28.6 |
| Agree | 82 | 63.6 | 65.1 | 93.7 | |
| Neutral | 8 | 6.2 | 6.3 | 100.0 | |
| Total | 126 | 97.7 | 100.0 | ||
| Missing | System | 3 | 2.3 | ||
| Total | 129 | 100.0 |
Table 7: An analysis of price fairness and loyalty
As evident in table 7, most of the respondents selected ‘agree’ as the answer. Since this represented over 60% of the respondents, it is conclusive to point out that price has the most impact on brand loyalty on the end of customers.
![[Solved] ENGL147N - Week 7 Assignment- Final Draft of the Argument Research Paper](https://prolifictutors.com/wp-content/uploads/2023/01/Solved-ENGL147N-Week-7-Assignment-Final-Draft-of-the-Argument-Research-Paper--240x142.png)
![[Solution] - NR305 - Week 3 Discussion: Debriefing of the Week 2 iHuman Wellness Assignment (Graded](https://prolifictutors.com/wp-content/uploads/2022/06/Best-Answer-NR305-Week-3-Discussion-Debriefing-of-the-Week-2-iHuman-Wellness-Assignment-Graded--240x142.png)

![[Best Answer] NR305 - Week 2 Discussion: Reflection on the Nurse’s Role in Health Assessment (Graded)](https://prolifictutors.com/wp-content/uploads/2022/06/Best-Answer-NR305-Week-2-Discussion-Reflection-on-the-Nurses-Role-in-Health-Assessment-Graded-240x142.png)
![[Best Answer] NR305 - Week 2 Assignment: Wellness Assessment: Luciana Gonzalez (iHuman) (Graded)](https://prolifictutors.com/wp-content/uploads/2022/06/Best-Answer-NR305-Week-2-Assignment-Wellness-Assessment-Luciana-Gonzalez-iHuman-Graded--240x142.png)
